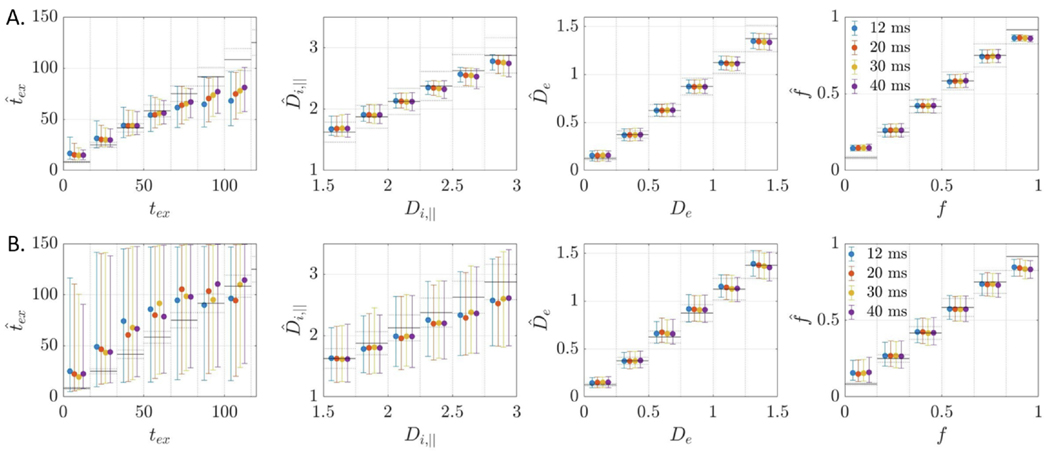
Fig. 7.
Simulation results fitting multi-shell data for each diffusion time separately using NLLS, without noise (A) or with SNR = 100 (B). Displayed is the ground truth (GT) vs estimation for 104 set of random parameters. Markers correspond to the median & IQR in the corresponding intervals. Black lines are the ideal estimation ± 10% error. In all cases, the precision is good on and acceptable on f. However, in a finite SNR case, and cannot be estimated, irrespective of the diffusion time.

