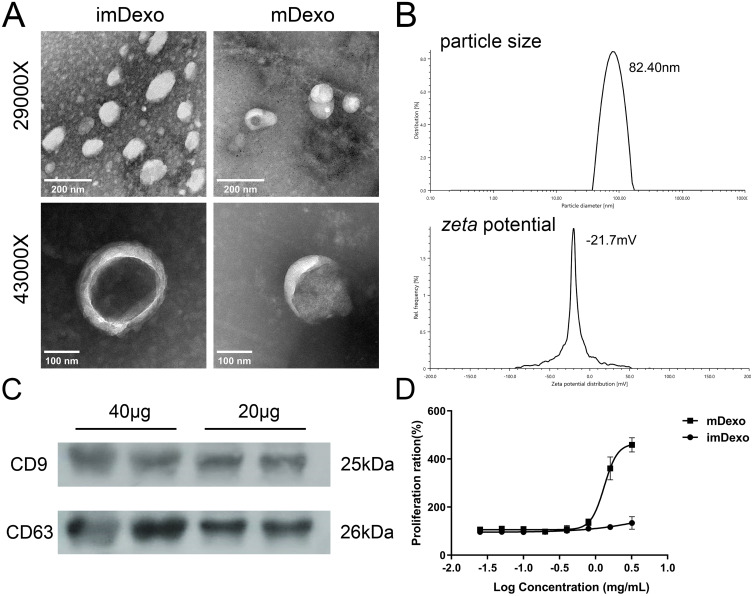
Figure 3.
Identification and characterization of mDexos. (A) TEM images, scale bars: 200 nm, magnification: 29,000X; scale bars: 100 nm, magnification: 43,000X. (B) Plots of particle size and zeta potential. (C) Western blotting. (D) T-lymphocyte proliferation after 48 h of incubation with different concentrations of Dexos. The data are reported as the mean ± standard deviation (n=6).

