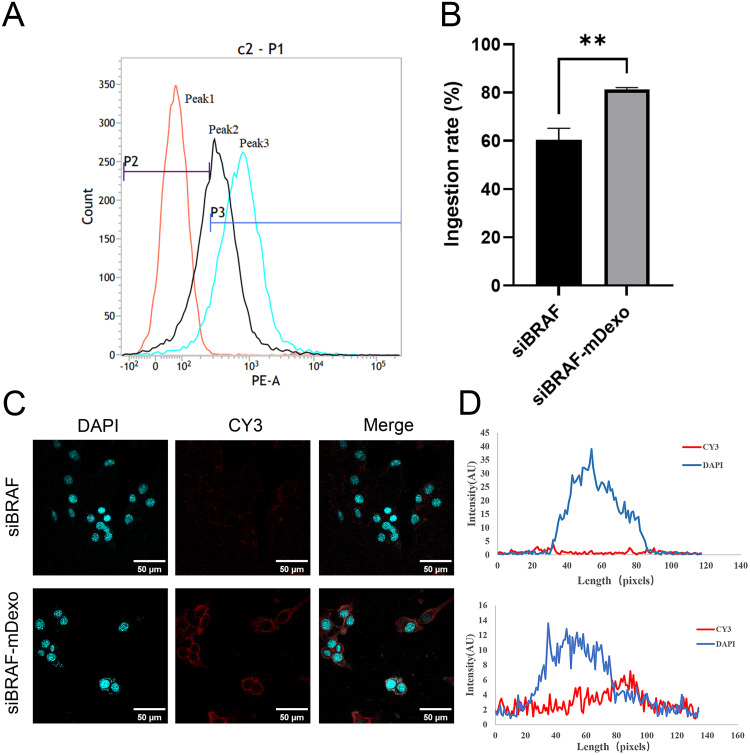
Figure 8.
Uptake of siBRAF-mDexos in B16-F10 cells over 12 h. (A) One-parameter histogram, peak 1: control, peak 2: siBRAF, peak 3: siBRAF-mDexos. (B) Histogram showing the uptake rate; **P<0.01 compared with the siBRAF group. (C) Fluorescence image, scale bar: 50 μm. (D) Fluorescence colocalization analysis. The data are reported as the mean ± standard deviation (n=3), one-way ANOVA.

