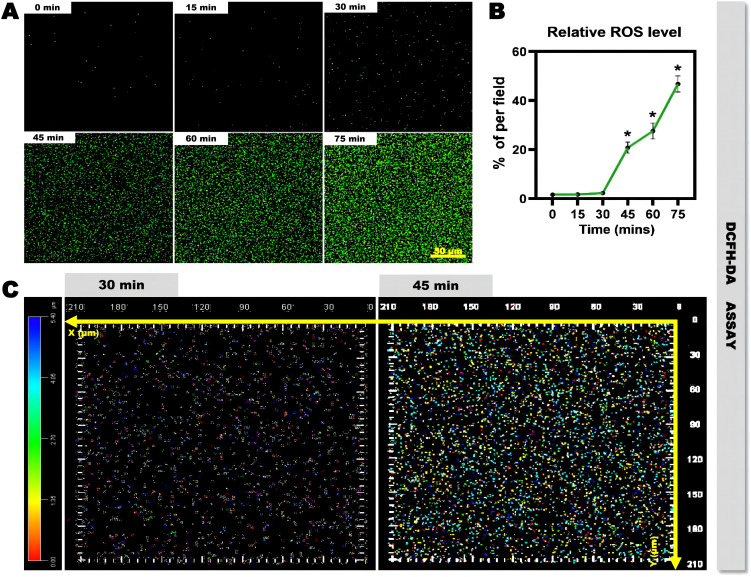
Figure 6.
Investigation of the antibacterial mechanism. (A) Confocal images of ROS levels in the MRSA biofilm grown on cell slides after incubation with TTO-NL@PCS covered at preset time points. (B) The corresponding statistical fold chart showing relative ROS-level time variation. (C) ROS levels at different stages of biofilm formation, as obtained from 3-D scanning via LSCM. n = 3, *P < 0.05.

