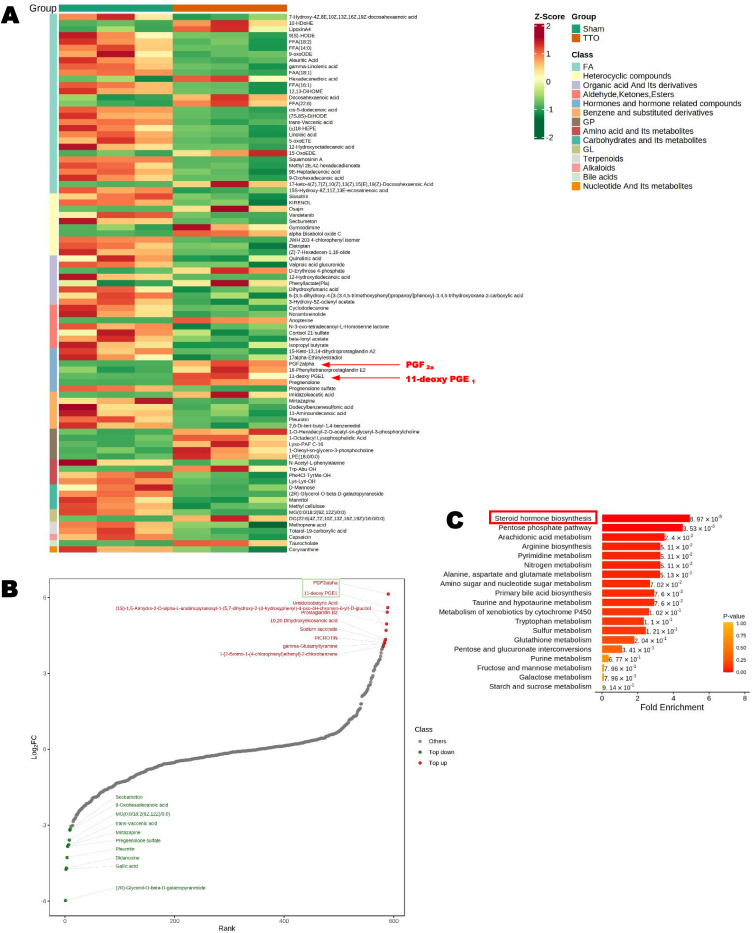
Figure 9.
Metabolomics assay. Kyoto Encyclopedia of Genes and Genomes (KEGG, http://www.genome.jp/kegg/) was used for the pathway mapping of differential metabolites. Differential metabolites were labeled on the KEGG pathway map, with bright red indicating upregulation and bright green indicating downregulation. (2) Mapping of KEGG and PubChem (https://pubchem.ncbi.nlm.nih.gov/) metabolite databases with differential metabolites. Through the comprehensive analysis of pathways with differential metabolites (including enrichment analysis and topological analysis), pathways were further screened to identify key pathways with the highest correlation with differences in metabolites (A) Heatmap of the differential metabolite clusters. (B) Dynamic distribution map of the differences in metabolite contents. (C) MSEA plot.

