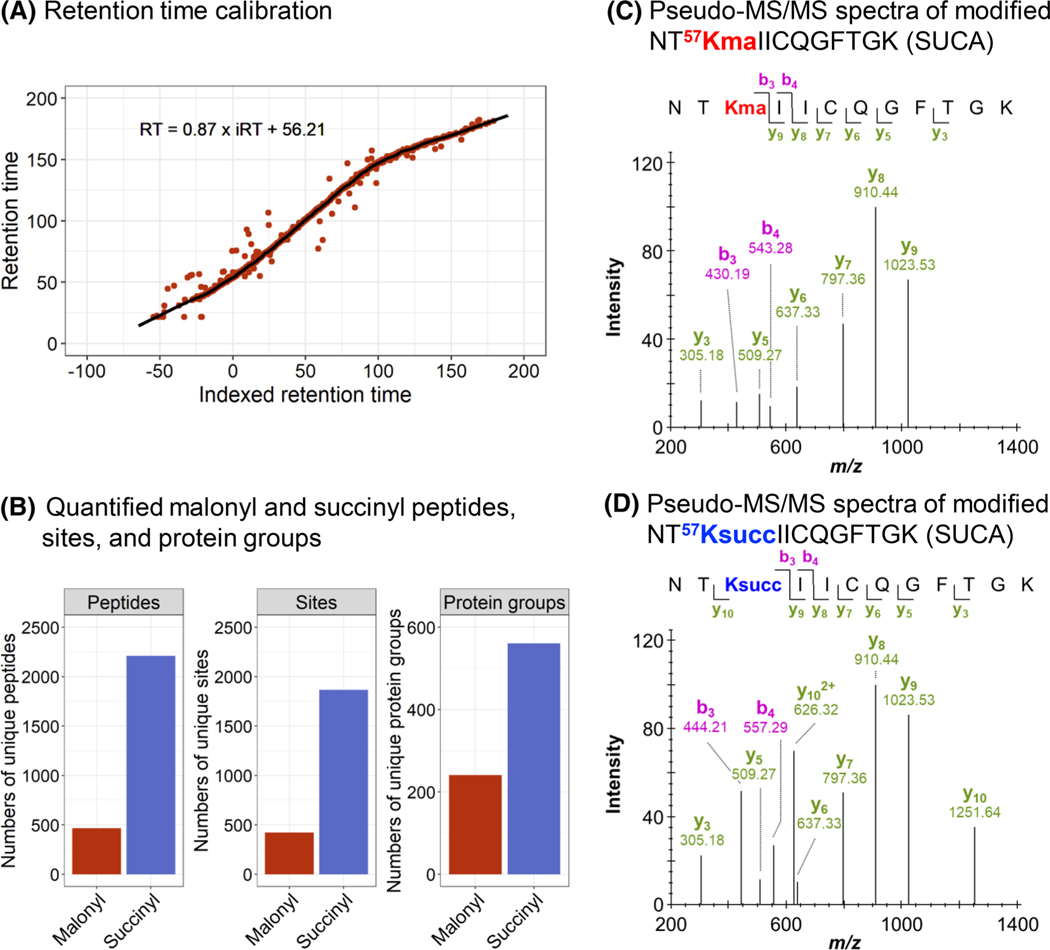
FIGURE 2.
Performance of the workflow for PTM sample analysis. (A) Retention time calibration obtained for a replicate of the malonyl data set. Red dots correspond to peptides used for the calibration, and the black line to the non-linear calibration curve. (B) Number of unique malonylated (red) and succinylated (blue) peptides, sites, and protein groups quantified. (C, D) Pseudo-MS/MS spectra generated by Spectronaut for the malonylated (C) and succinylated (D) peptide NT57KIICQGFTGK of the mitochondrial succinate-CoA ligase [ADP/GDP-forming] subunit alpha (SUCA). Detected b and y ions show similar fragmentation patterns for both malonylated and succinylated peptides. The fragment ions b3, b4, and y10 contain the acyl group and have different m/z depending on the PTM types. ADP, adenosine diphosphate; CoA, coenzyme A; MS/MS, tandem mass spectrometry; PTM, post-translational modification

