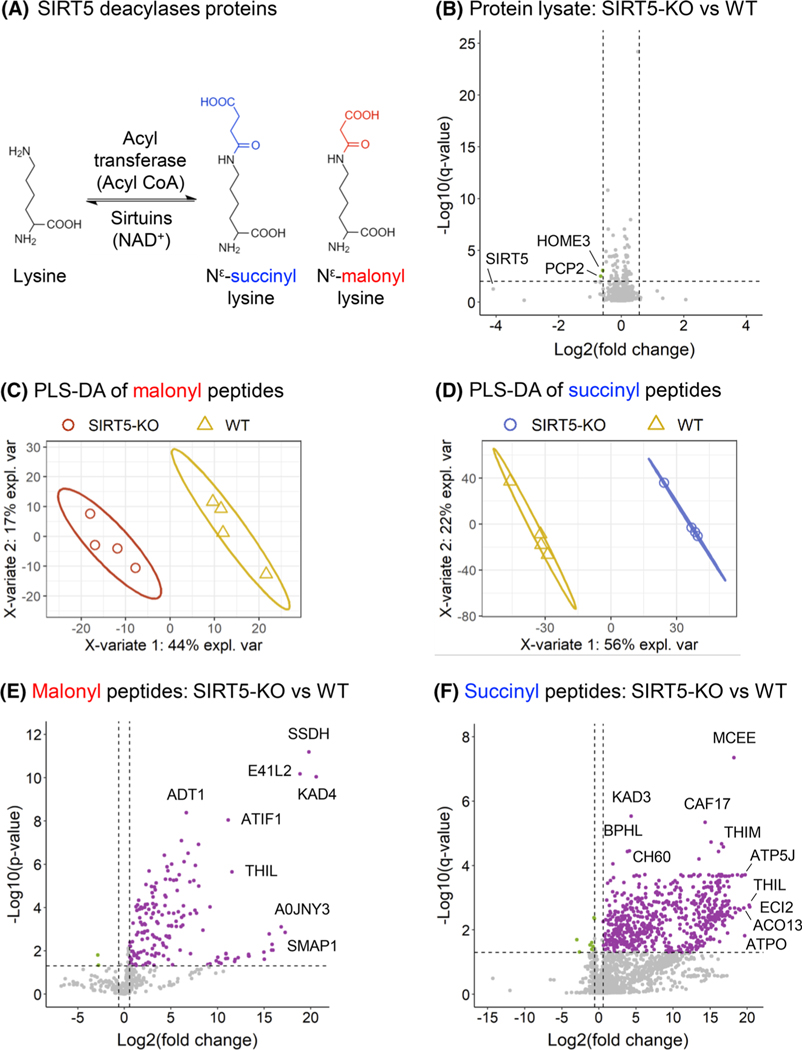
FIGURE 3.
Remodeling of mouse brain malonylome and succinylome by SIRT5. (A) Schematic of the regulation of lysine malonylation and succinylation. (B) Volcano plot of the 2837 protein groups quantified in whole-lysate samples, with two downregulated proteins groups obtained for SIRT5-KO versus WT comparison. (C, D) Supervised clustering analysis using PLS-DA performed on all malonylated (C) and succinylated (D) peptides quantified in the WT (WT; yellow) and SIRT5-KO (red for malonyl, blue for succinyl) samples. (E) Volcano plot of the 466 quantified malonylated peptides, with 169 up- and two downregulated malonylated peptides obtained for SIRT5-KO versus WT comparison (p-value < 0.05 and absolute log2(fold-change) > 0.58). (F) Volcano plot of the 2211 quantified succinylated peptides, with 630 up- and 10 downregulated succinylated peptides obtained for SIRT5-KO versus WT comparison (q-value < 0.05 and absolute log2(fold-change) > 0.58). KO, knock-out; PLS-DA, partial least squares-discriminant analysis; SIRT5, Sirtuin 5; WT, wild-type

