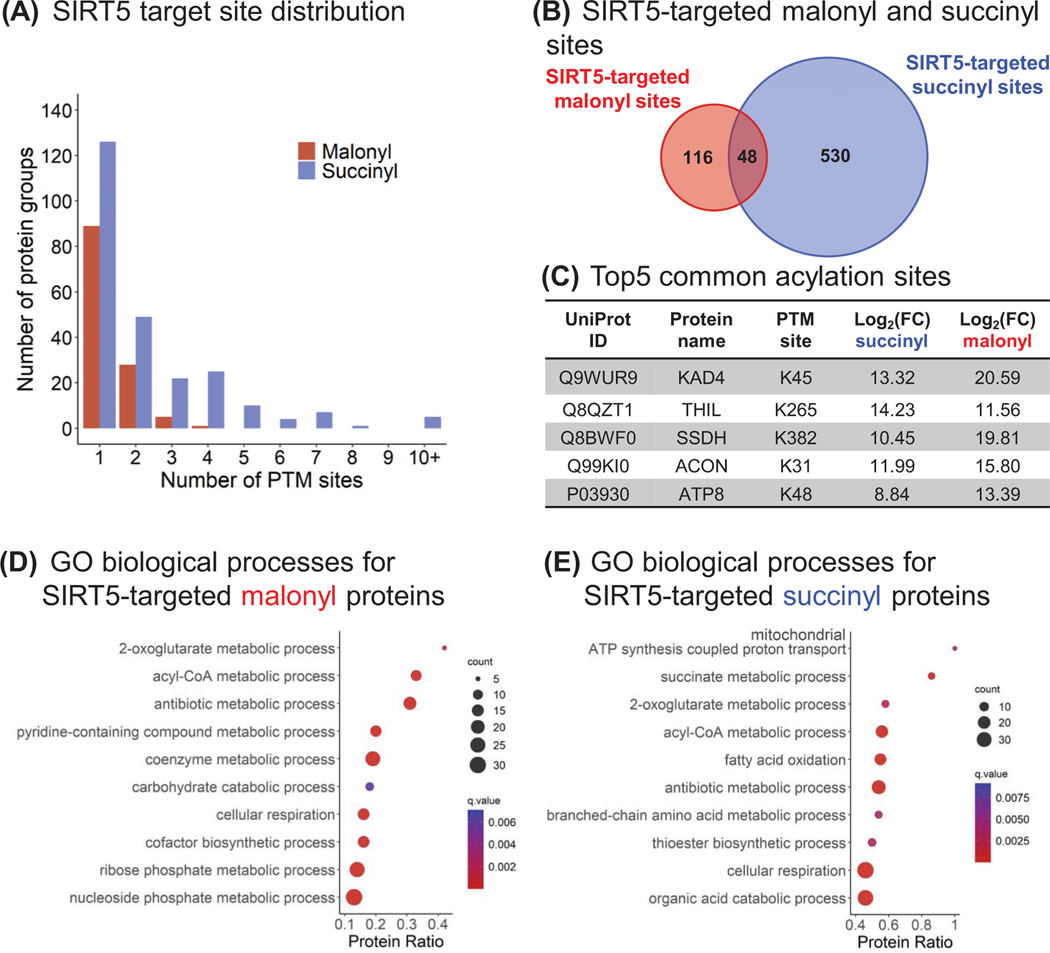
FIGURE 4.
Crosstalk between brain lysine malonylation and succinylation. (A) Distribution of the malonyl (red) and succinyl (blue) sites targeted by SIRT5. (B) Venn diagram comparing the SIRT5-targeted malonyl and succinyl sites. The 48 common sites belong to 36 protein groups, and the top five sites are listed (C). (D, E) Dotplots showing the ConsensusPathDB [54, 55] GO biological processes enriched for SIRT5-regulated malonyl (D) and succinyl (E) proteins. The x-axis corresponds to the proportion of proteins constituting a GO biological process that are significantly up-regulated in these datasets. GO, Gene Ontology; SIRT5, Sirtuin 5

