
Figure 2.
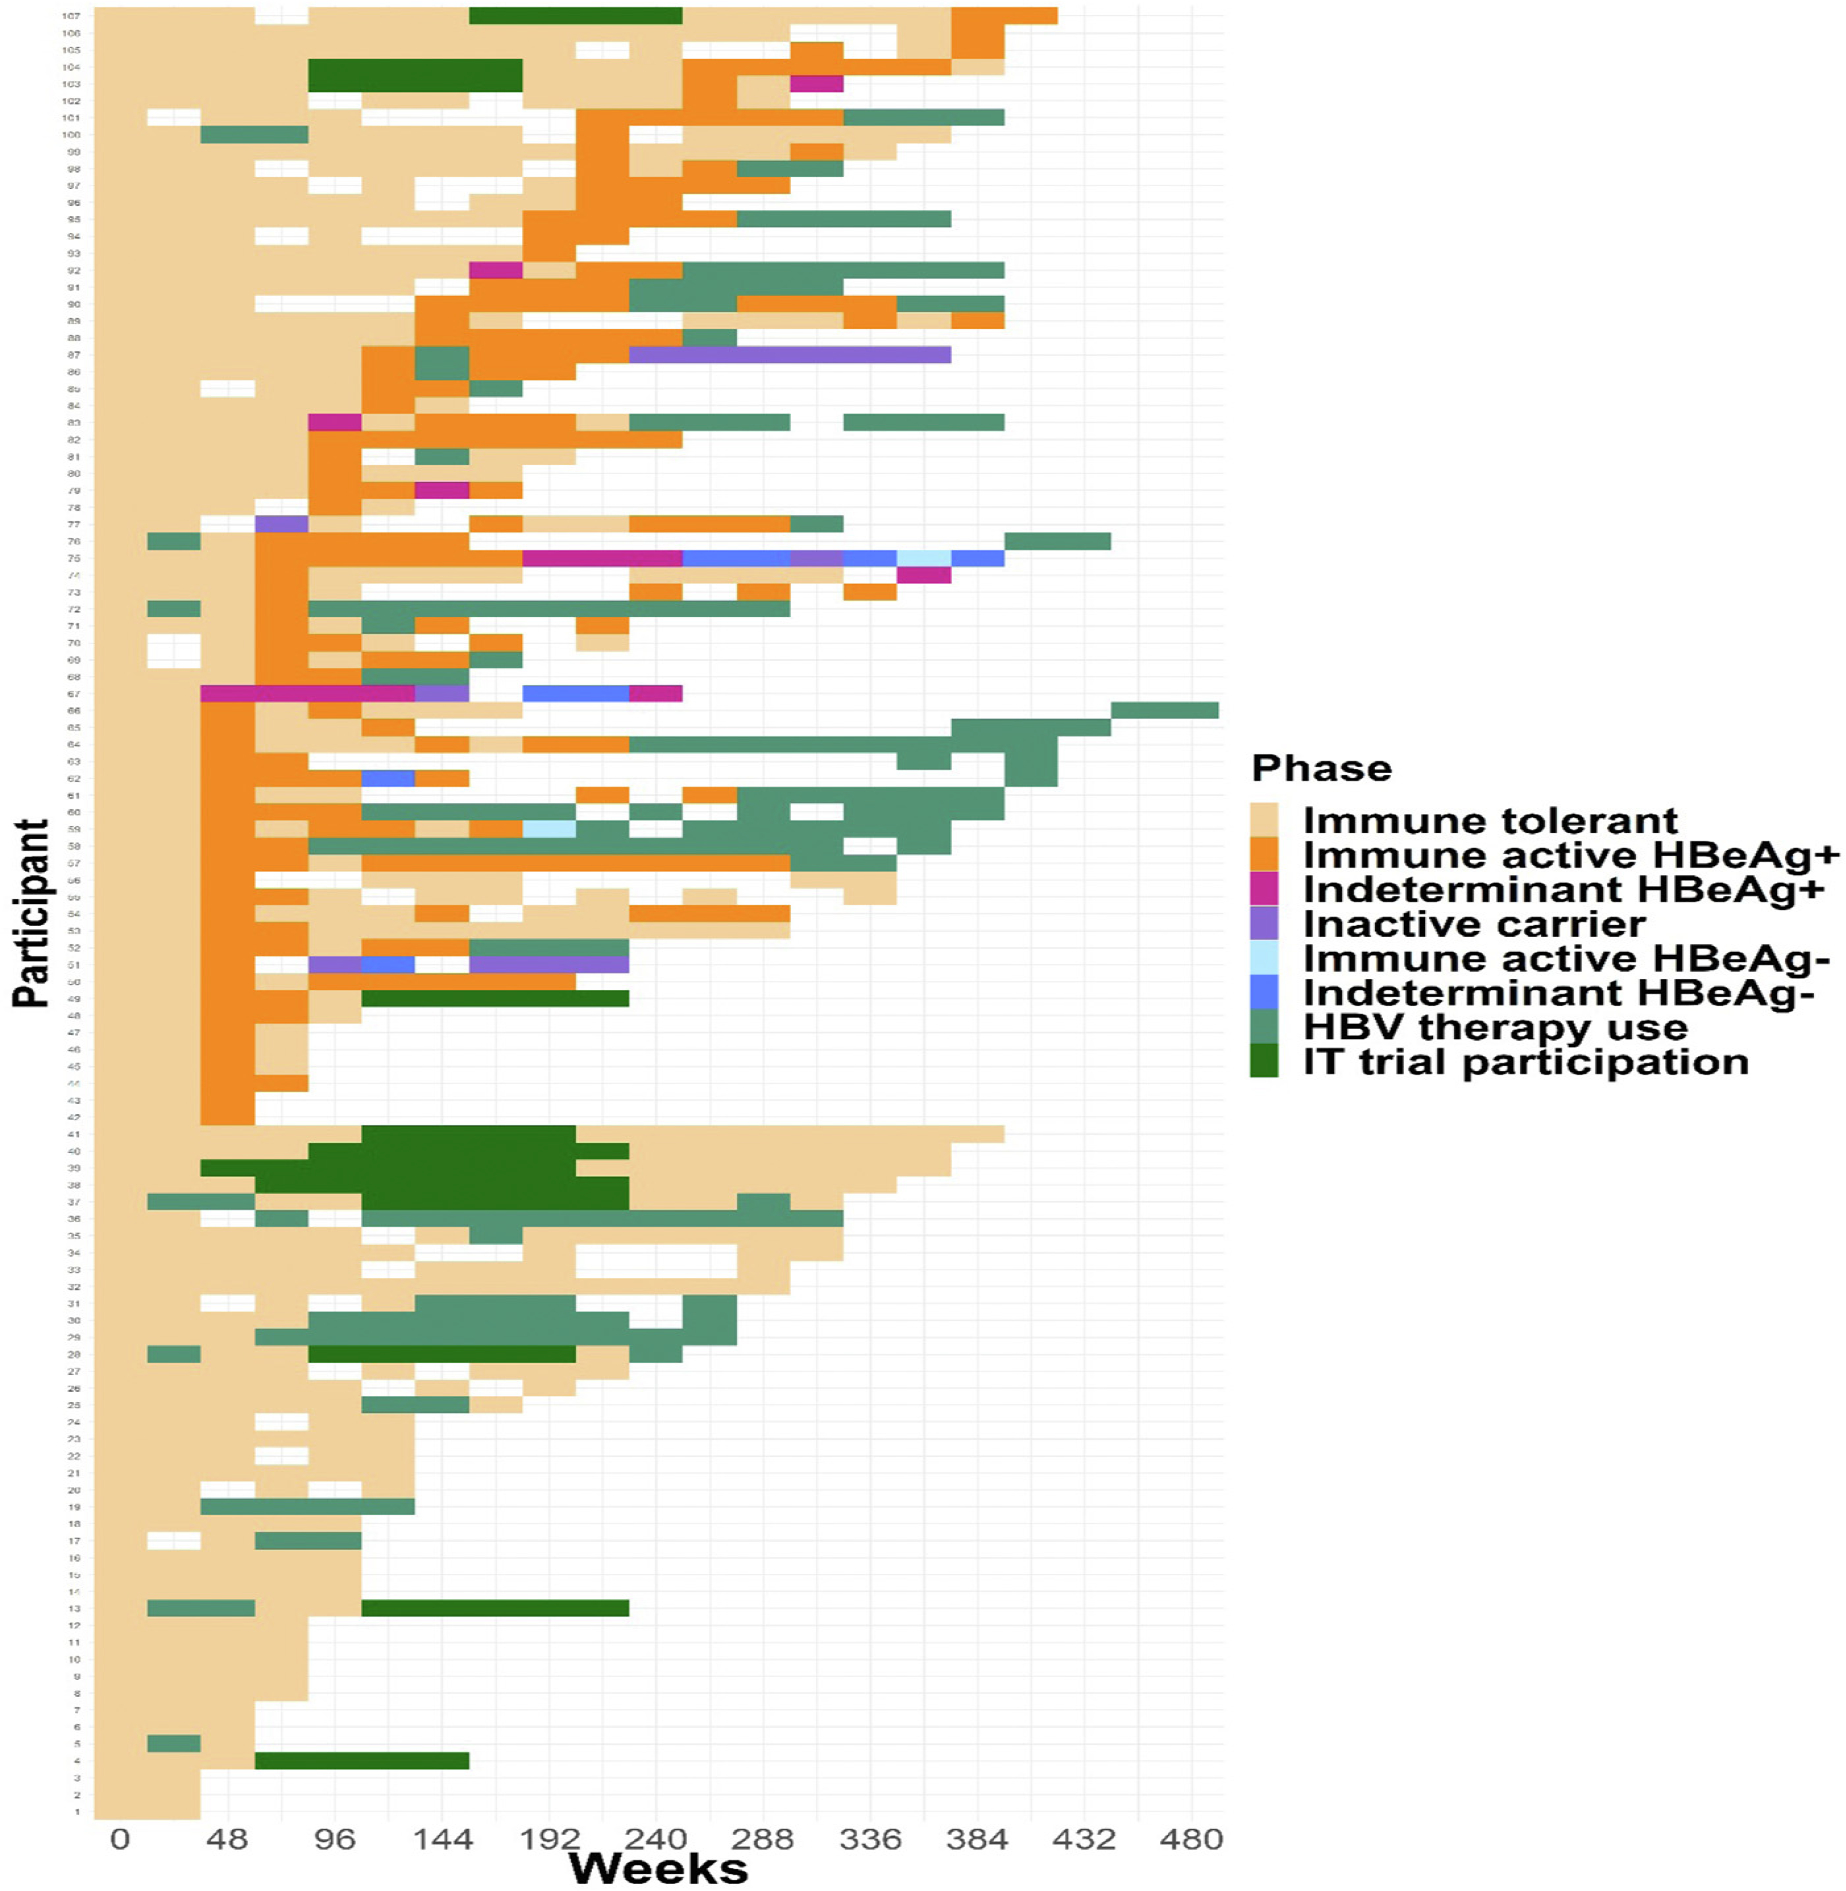
Heat map of CHB phases over time among the IT cohort (N = 107). Transitions from the IT phase to other CHB phases are shown over time for each participant. Follow-up time is shown from the first sustained period in the IT phase for each participant until the end of follow-up.