
Figure 1. Conformational dynamics analysis of SEVI and Aβ monomer.
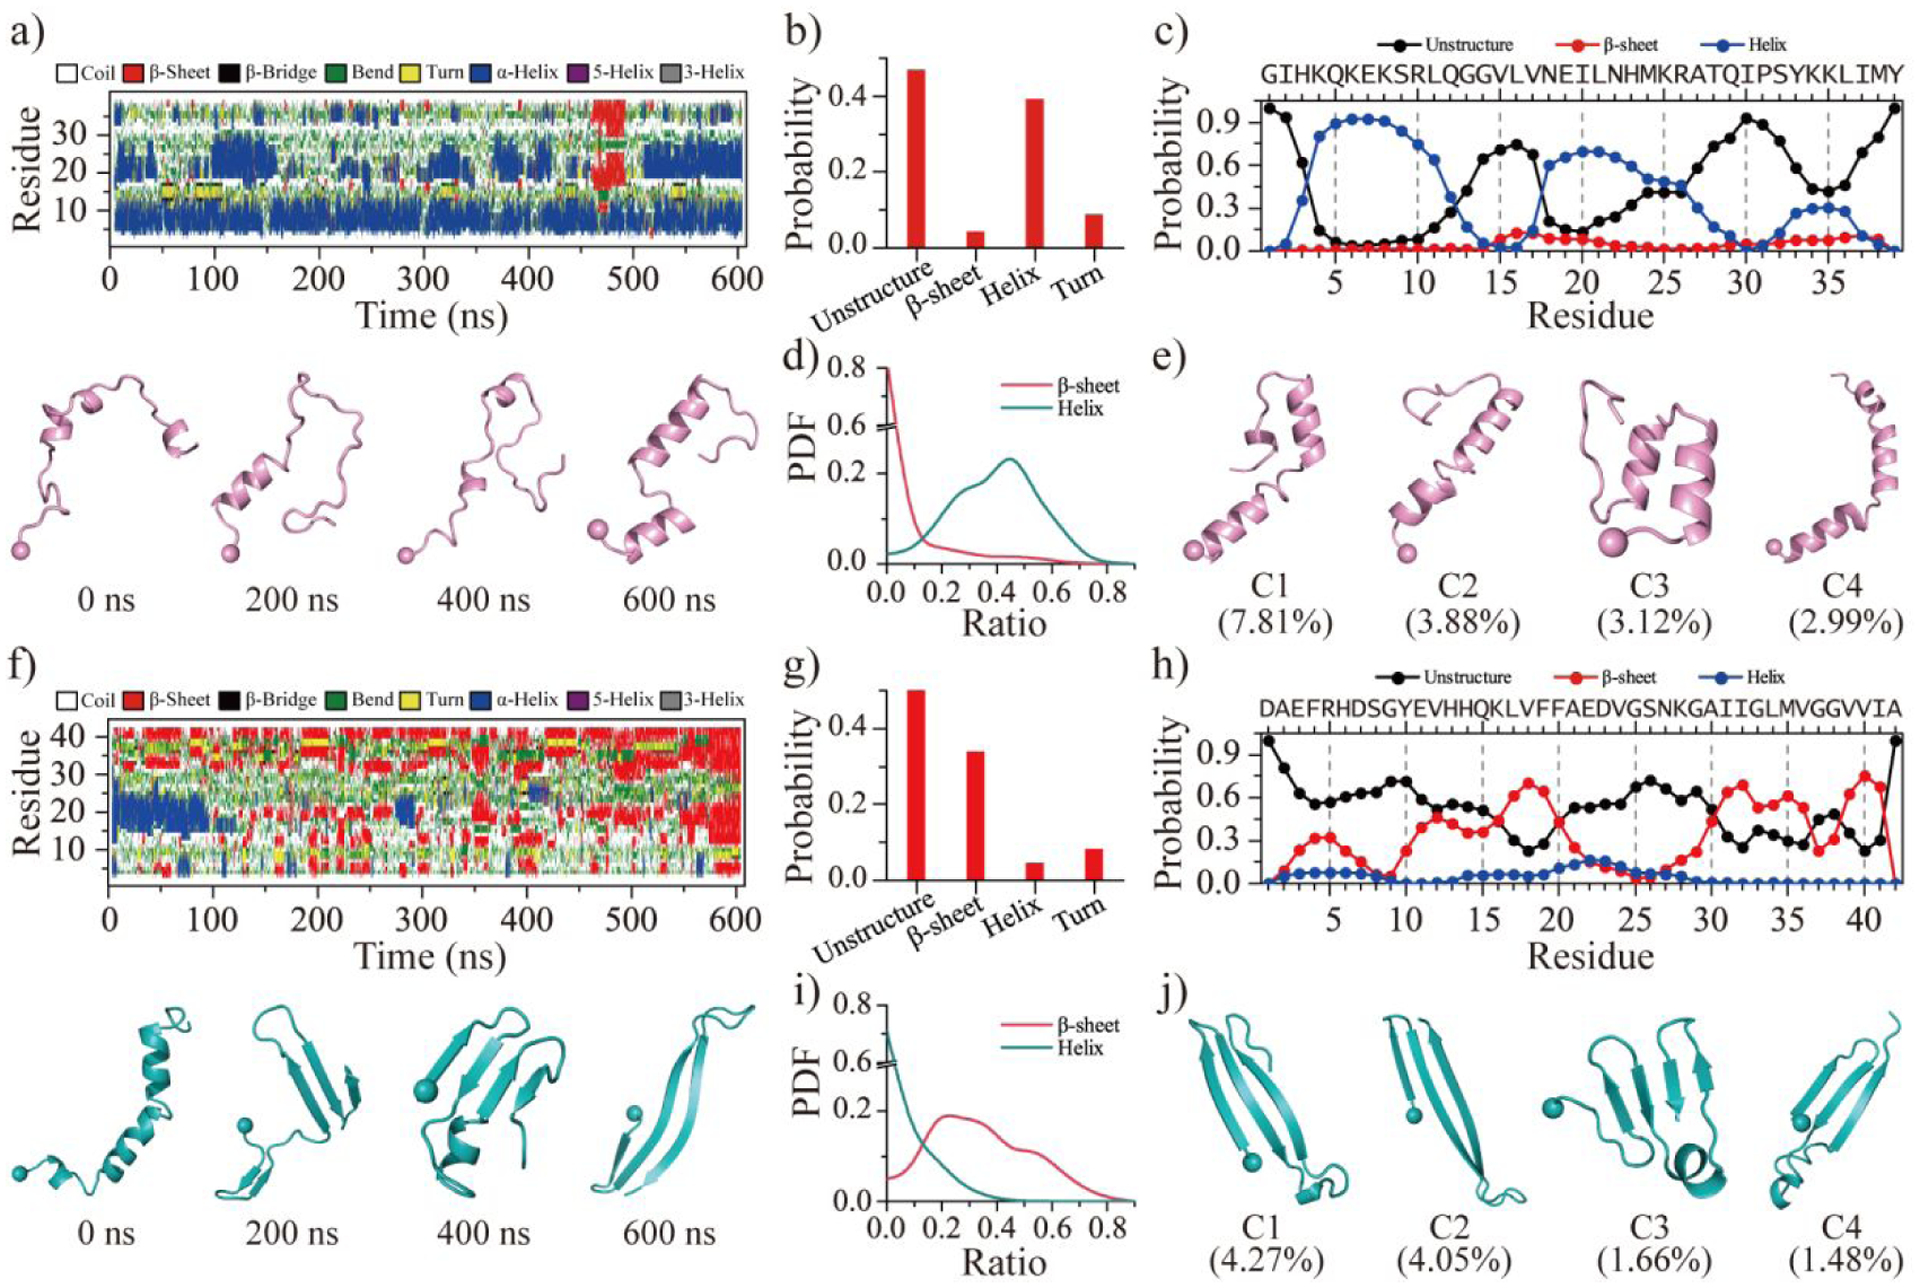
The time evolution of the secondary structure for each residue from SEVI a) and Aβ f). The snapshots of each monomer along the simulation trajectory are also presented every 200 ns. The average secondary structure contents of unstructured (coil and bend), β-sheet, helix, and turn conformations for SEVI b) and Aβ g) monomer during the last 300 ns DMD simulations. The propensity of each residue from SEVI c) and Aβ h) adopted the unstructured (coil and bend), β-sheet, and helix during the last 300 ns. The probability distribution as a function of the secondary structure contents of β-sheet and helix for each SEVI d) and Aβ i) monomer. Representative monomeric conformations of the top four most-populated clusters of SEVI e) and Aβ j). The N-terminal Cα atom is highlighted as a bead. Monomers of SEVI and Aβ are colored pink and cyan, respectively.