
Figure 2. Homo/hetero-dimerization dynamics and free energy landscape of SEVI and Aβ.
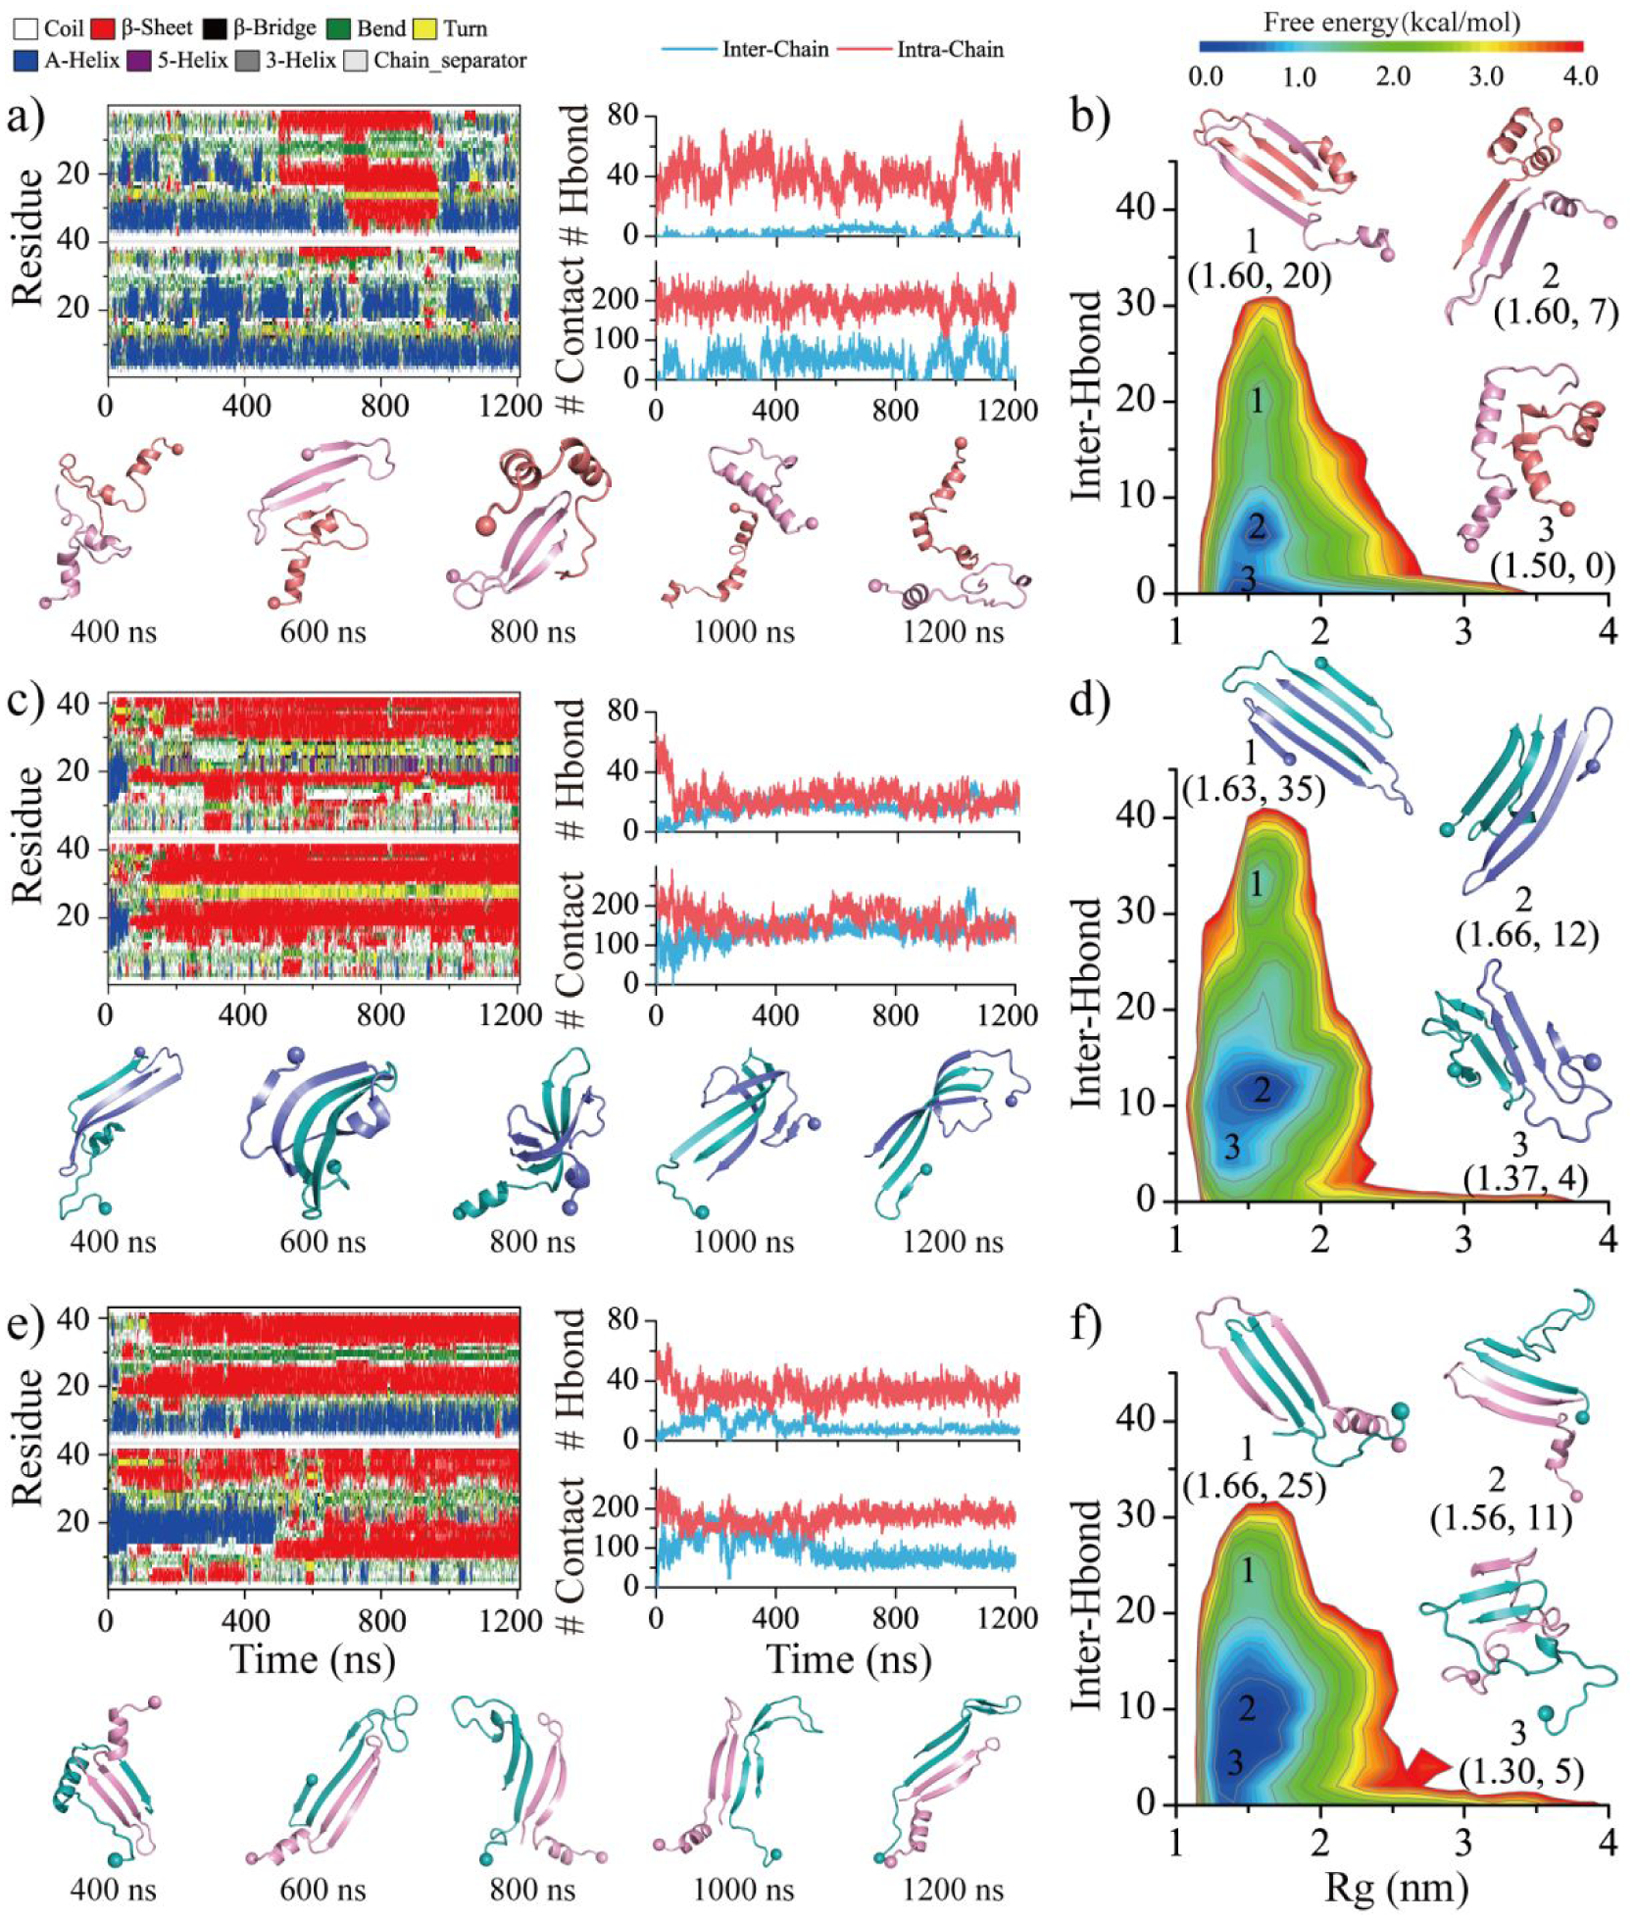
The time evolution of the secondary structure for each residue (first column) and the number of backbone hydrogen bonds and heavy contacts (second column) for the simulations of two SEVI a), two Aβ c), and one SEVI along with one Aβ e) peptides. According to the simulation time, the snapshots are presented every 400 ns. The conformational free energy landscape as a function of the radius gyration (Rg) and the total number of inter-chain backbone hydrogen bonds in self-assemblies of SEVI homo-dimer b), Aβ homo-dimer d), and SEVI-Aβ hetero-dimer f). Three representative structures labeled in the PMFs are also shown as insets. Only the last 600 ns simulation data from each independent DMD trajectory is used for the conformational free energy landscape analysis. For clarity, the SEVI peptides are colored red and pink, and the Aβ are colored blue and cyan.