
Figure 5. Co-aggregation dynamic and conformation analysis for two SEVI mixed with two Aβ peptides.
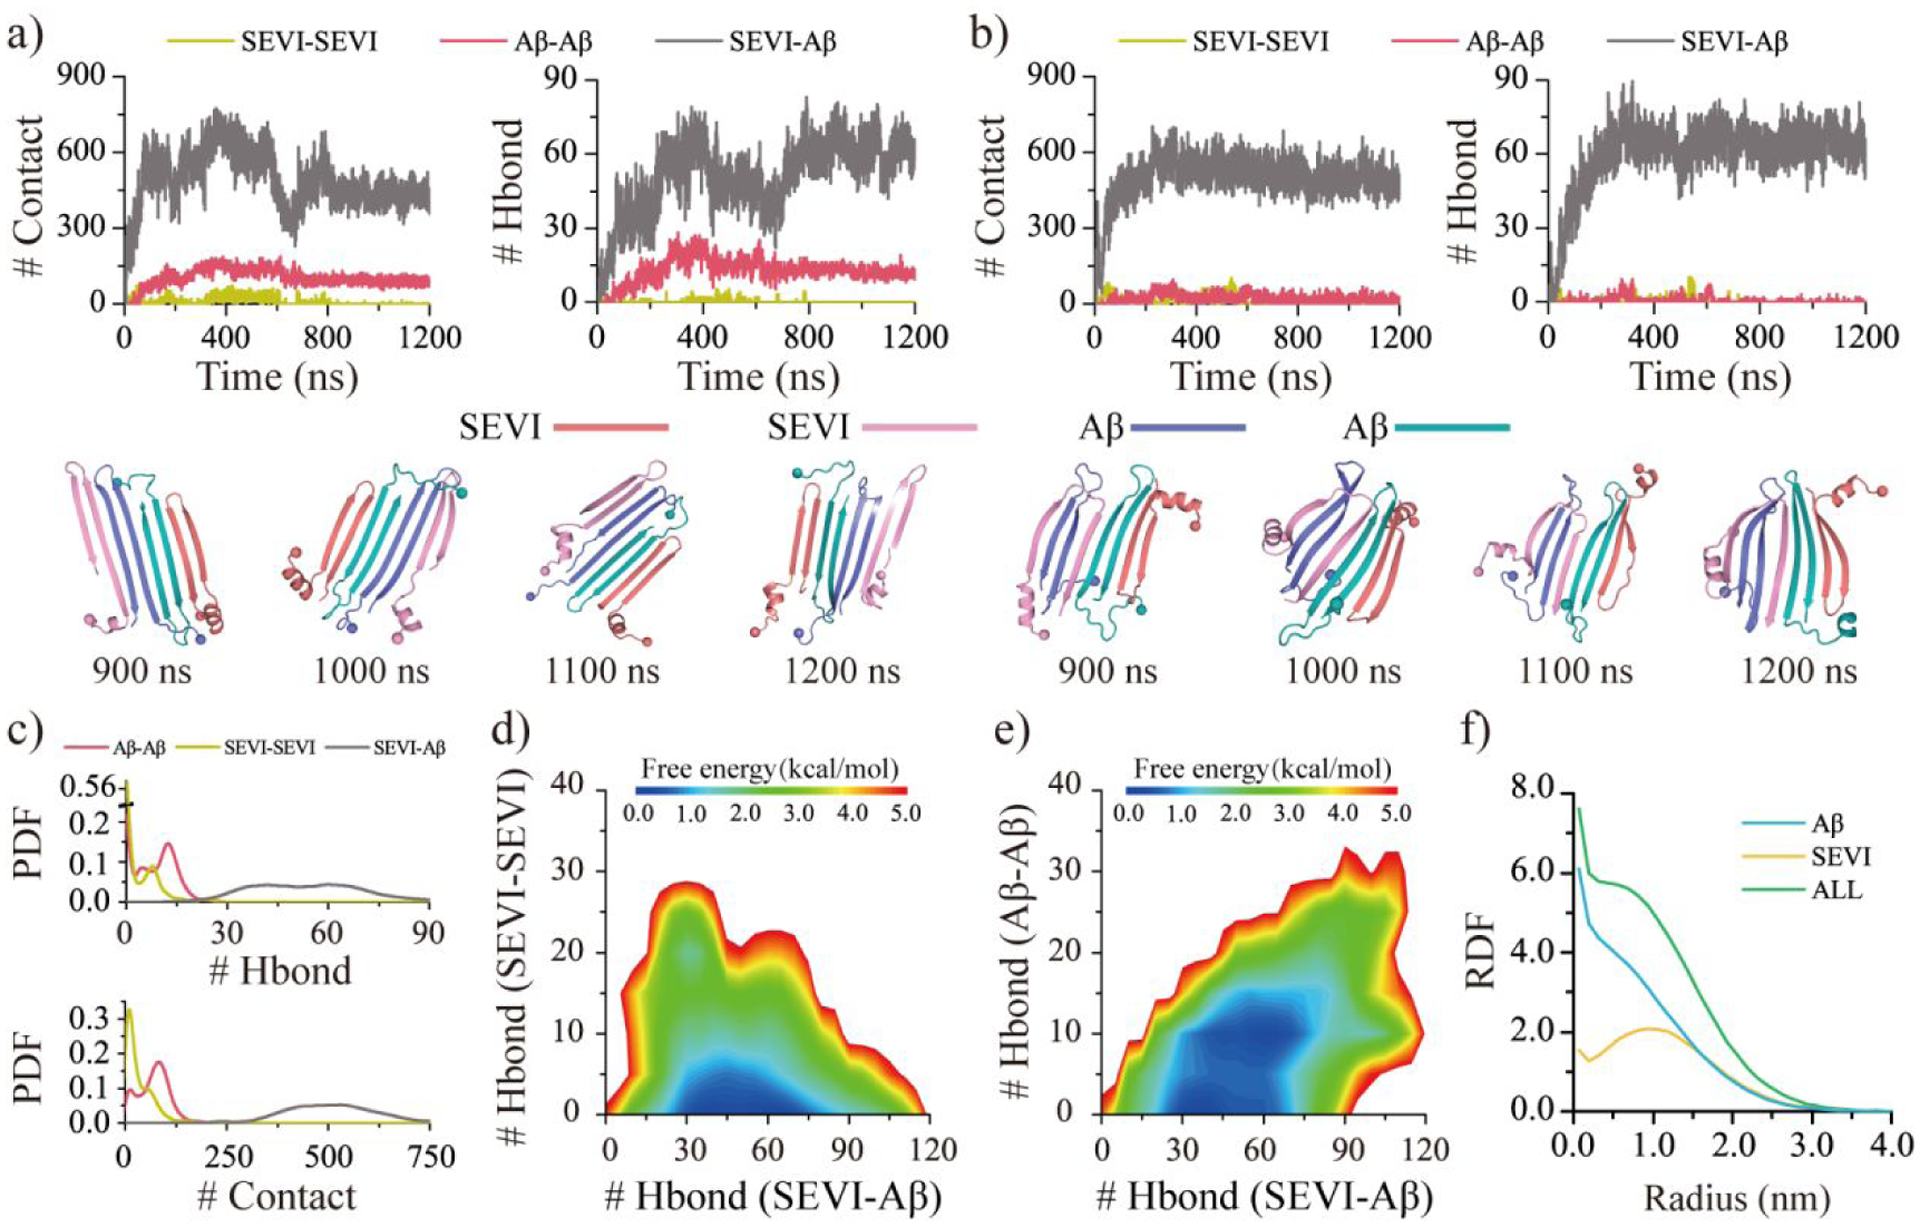
The co-aggregation dynamics are monitored by the time evolution of the number of the inter-peptide Aβ-Aβ, SVEI-SEVI, and SEVI-Aβ contacts and hydrogen bonds a&b). The snapshots during the last 300 ns are shown every 100 ns. Representative trajectories with two Aβ separately a) and jointly b) attached to the SEVI peptide are randomly selected from 50 independent DMD trajectories. The inter-peptide interactions are analyzed by the probability distribution of Aβ-Aβ, SVEI-SEVI, and SEVI-Aβ intermolecular contacts and hydrogen bonds c). The conformational free energy landscape as a function of the number of the inter-peptide SEVI-Aβ and SVEI-SEVI hydrogen bonds d) along with SEVI-Aβ and Aβ-Aβ hydrogen bonds e) in each co-aggregates. The radius distribution function (RDF) of Cα atoms from Aβ and SVEI corresponds to the geometry center of their hetero-aggregates f). Only the last 600 ns simulation data from each independent DMD trajectory is used for the conformational analysis. For clarity, the SEVI peptides are colored red and pink, and Aβ are colored blue and cyan.