
Figure 6. The binding dynamic analysis of SEVI monomer to Aβ fibril.
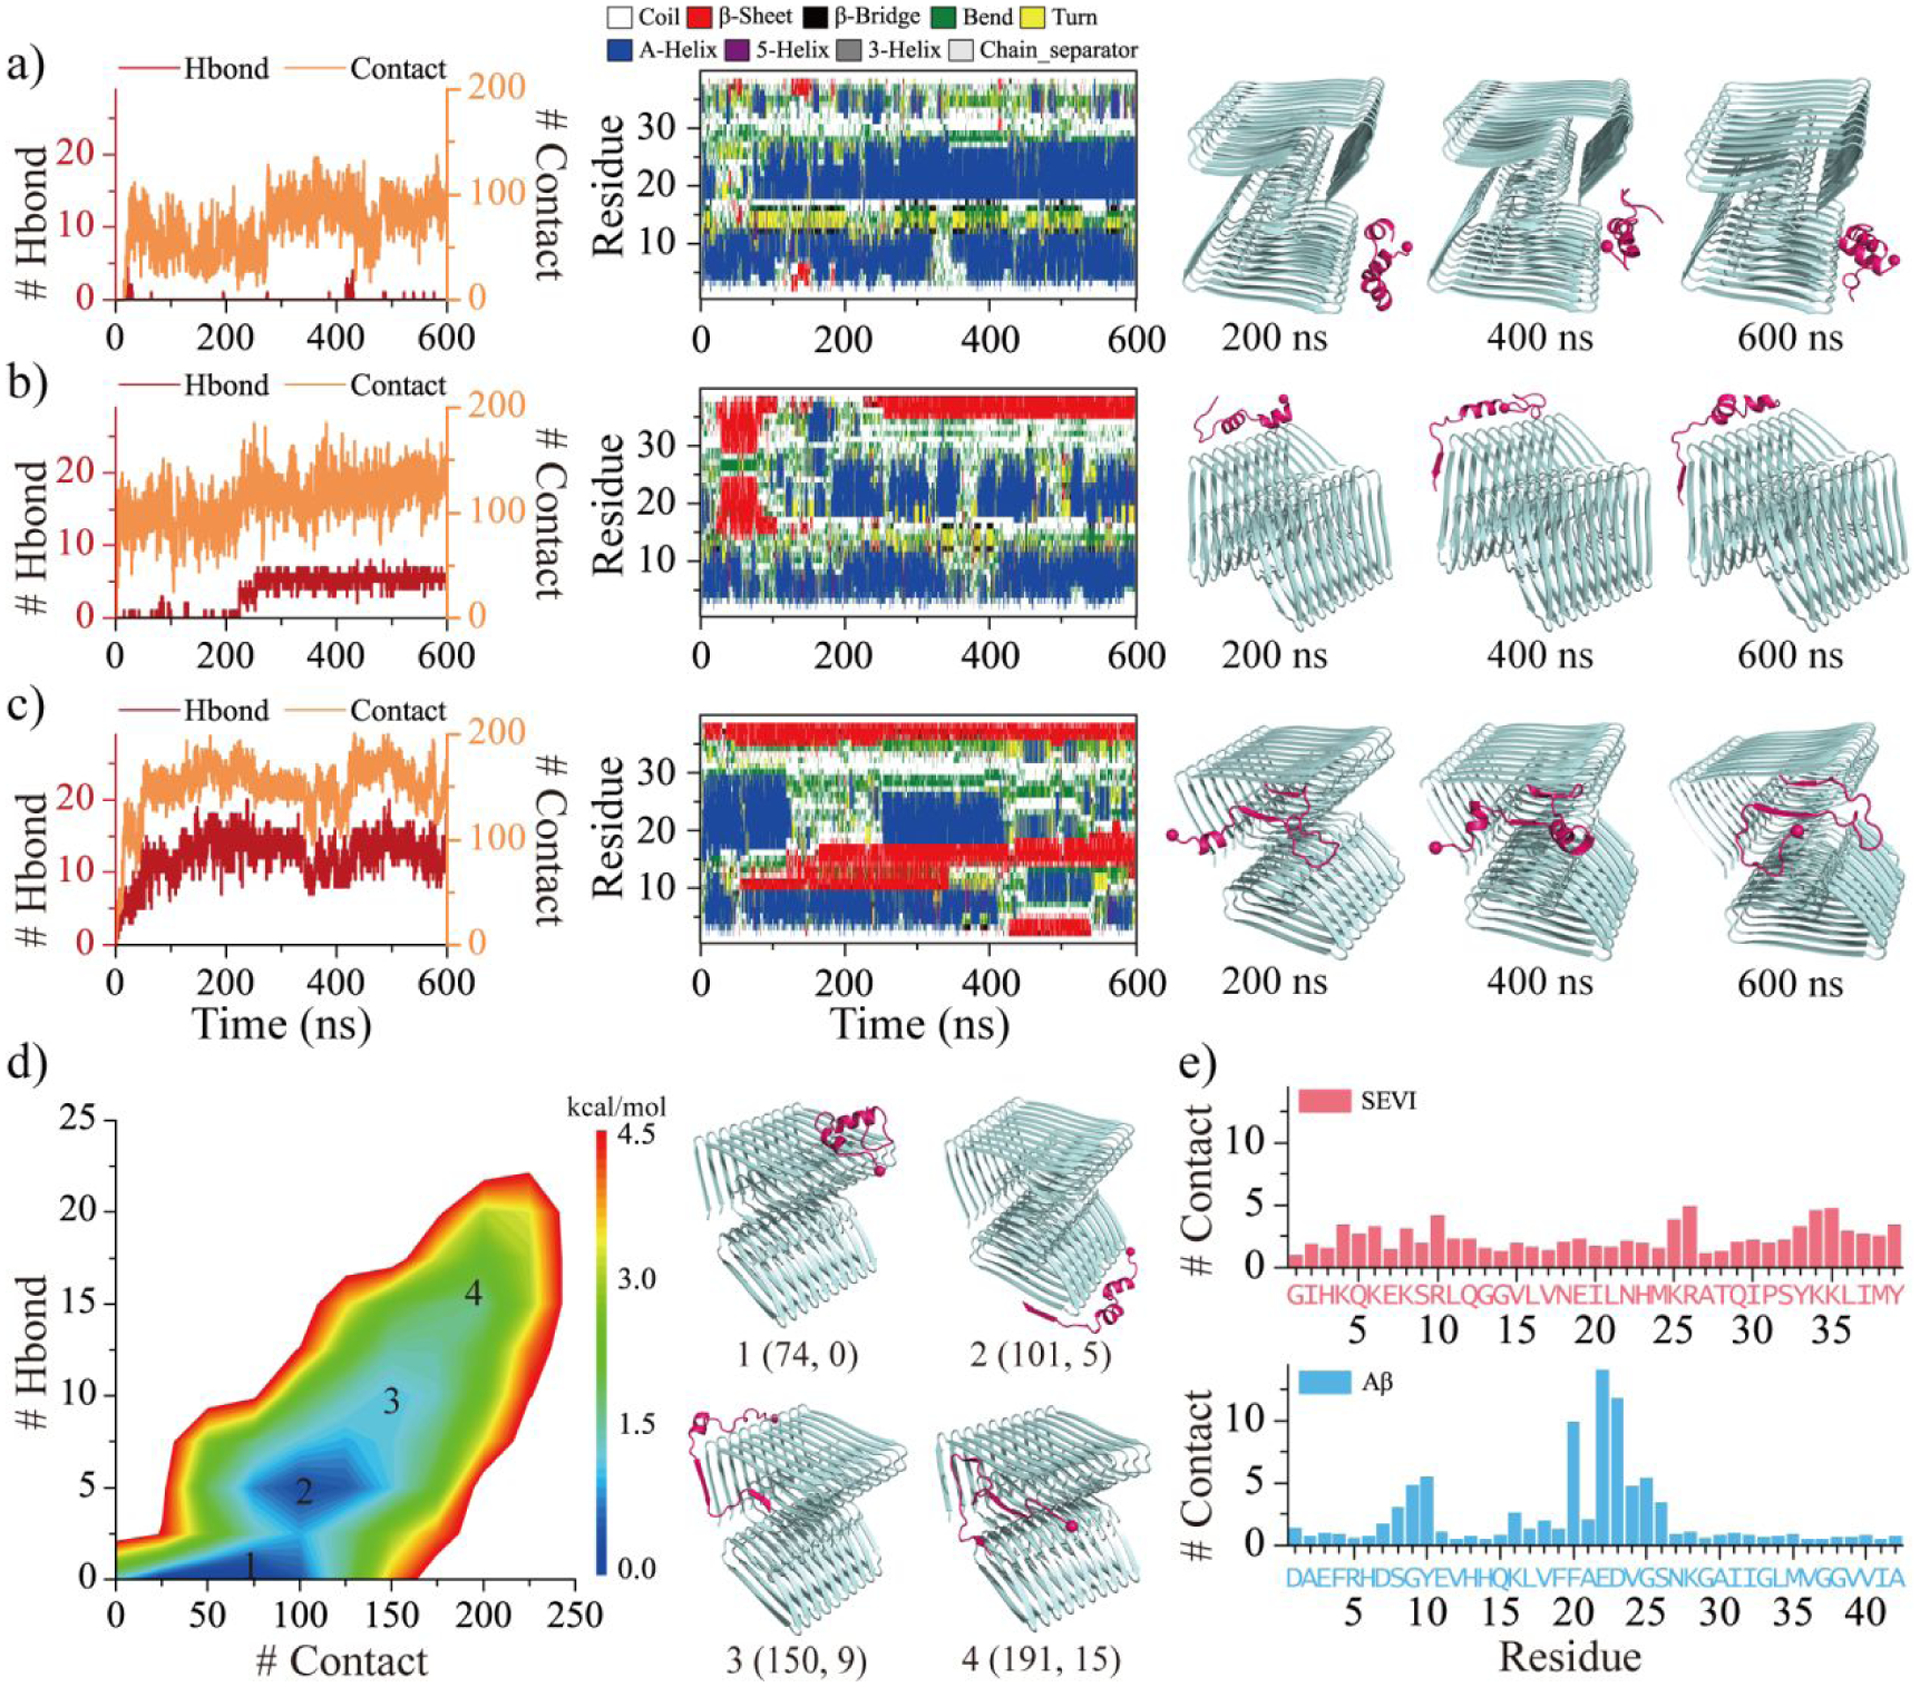
Interactions between SEVI monomer to Aβ fibril are monitored by the time evolution of the number of backbone hydrogen bonds and residue-pairwise contacts between SEVI and Aβ (left panel), and the secondary structure of each residue of SEVI monomer (middle panel) a-c). The corresponding snapshots are presented every 200 ns on the right. Three representative trajectories with the binding region mainly around lateral surface a), lateral mixed with elongation surfaces b), and elongation surface c) are selected from 50 independent DMD runs. The potential mean force as a function of the number of residue-pairwise contacts and backbone hydrogen bonds formed between SEVI and Aβ d). Four representative structures labeled 1–4 in the PMFs (1, 2, 3, 4) are also shown on the right. The average number of SEVI-Aβ contact per residue from SEVI (upper) and Aβ (bottom) e).