
Figure 1. Self-assembly dynamics of αS repeats.
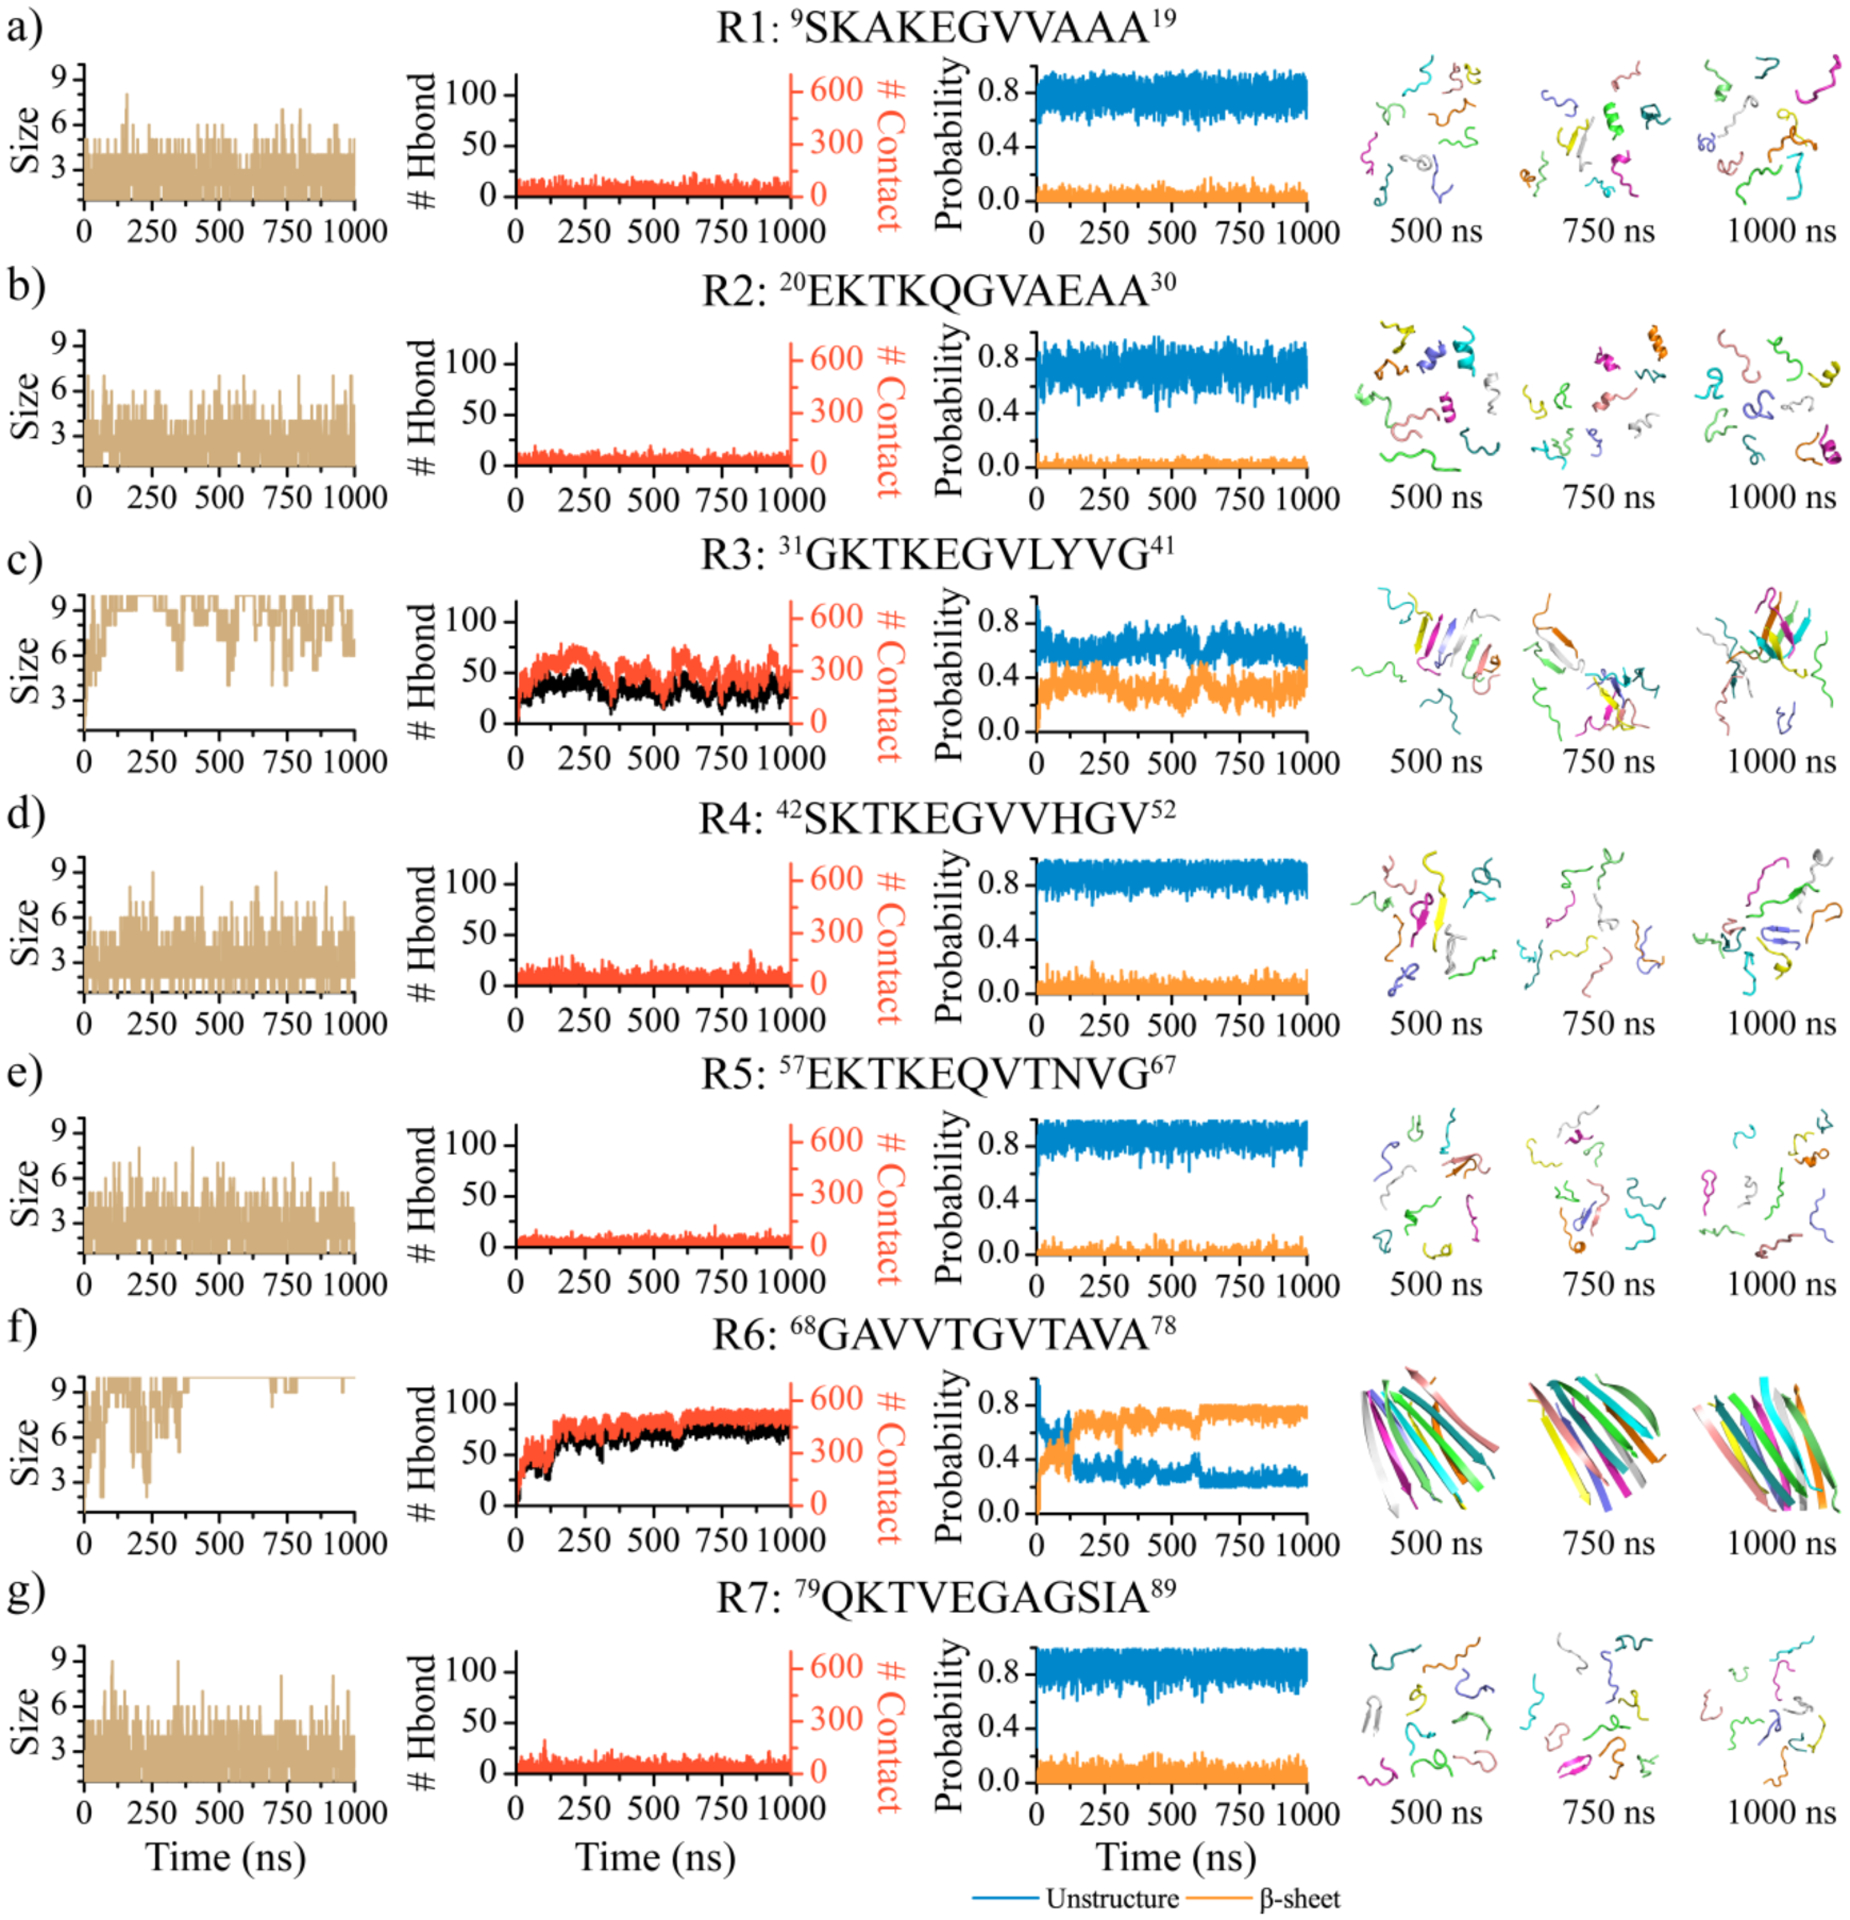
One representative trajectory is randomly selected from 30 independent DMD simulations to illustrate the self-assembly dynamics of each αS repeat: R1 a), R2 b), R3 c), R4 d), R5e), R6 f), and R7 g). The first column displays the time evolution of the largest oligomer size. The second column shows the time evolution of the total number of inter-molecular hydrogen bonds and contacts. The third column presents the averaged contents of the unstructured and β-sheet conformations as a function of simulation time. Snapshots along the simulation trajectory at 500, 750, and 1000 ns are presented to the right.