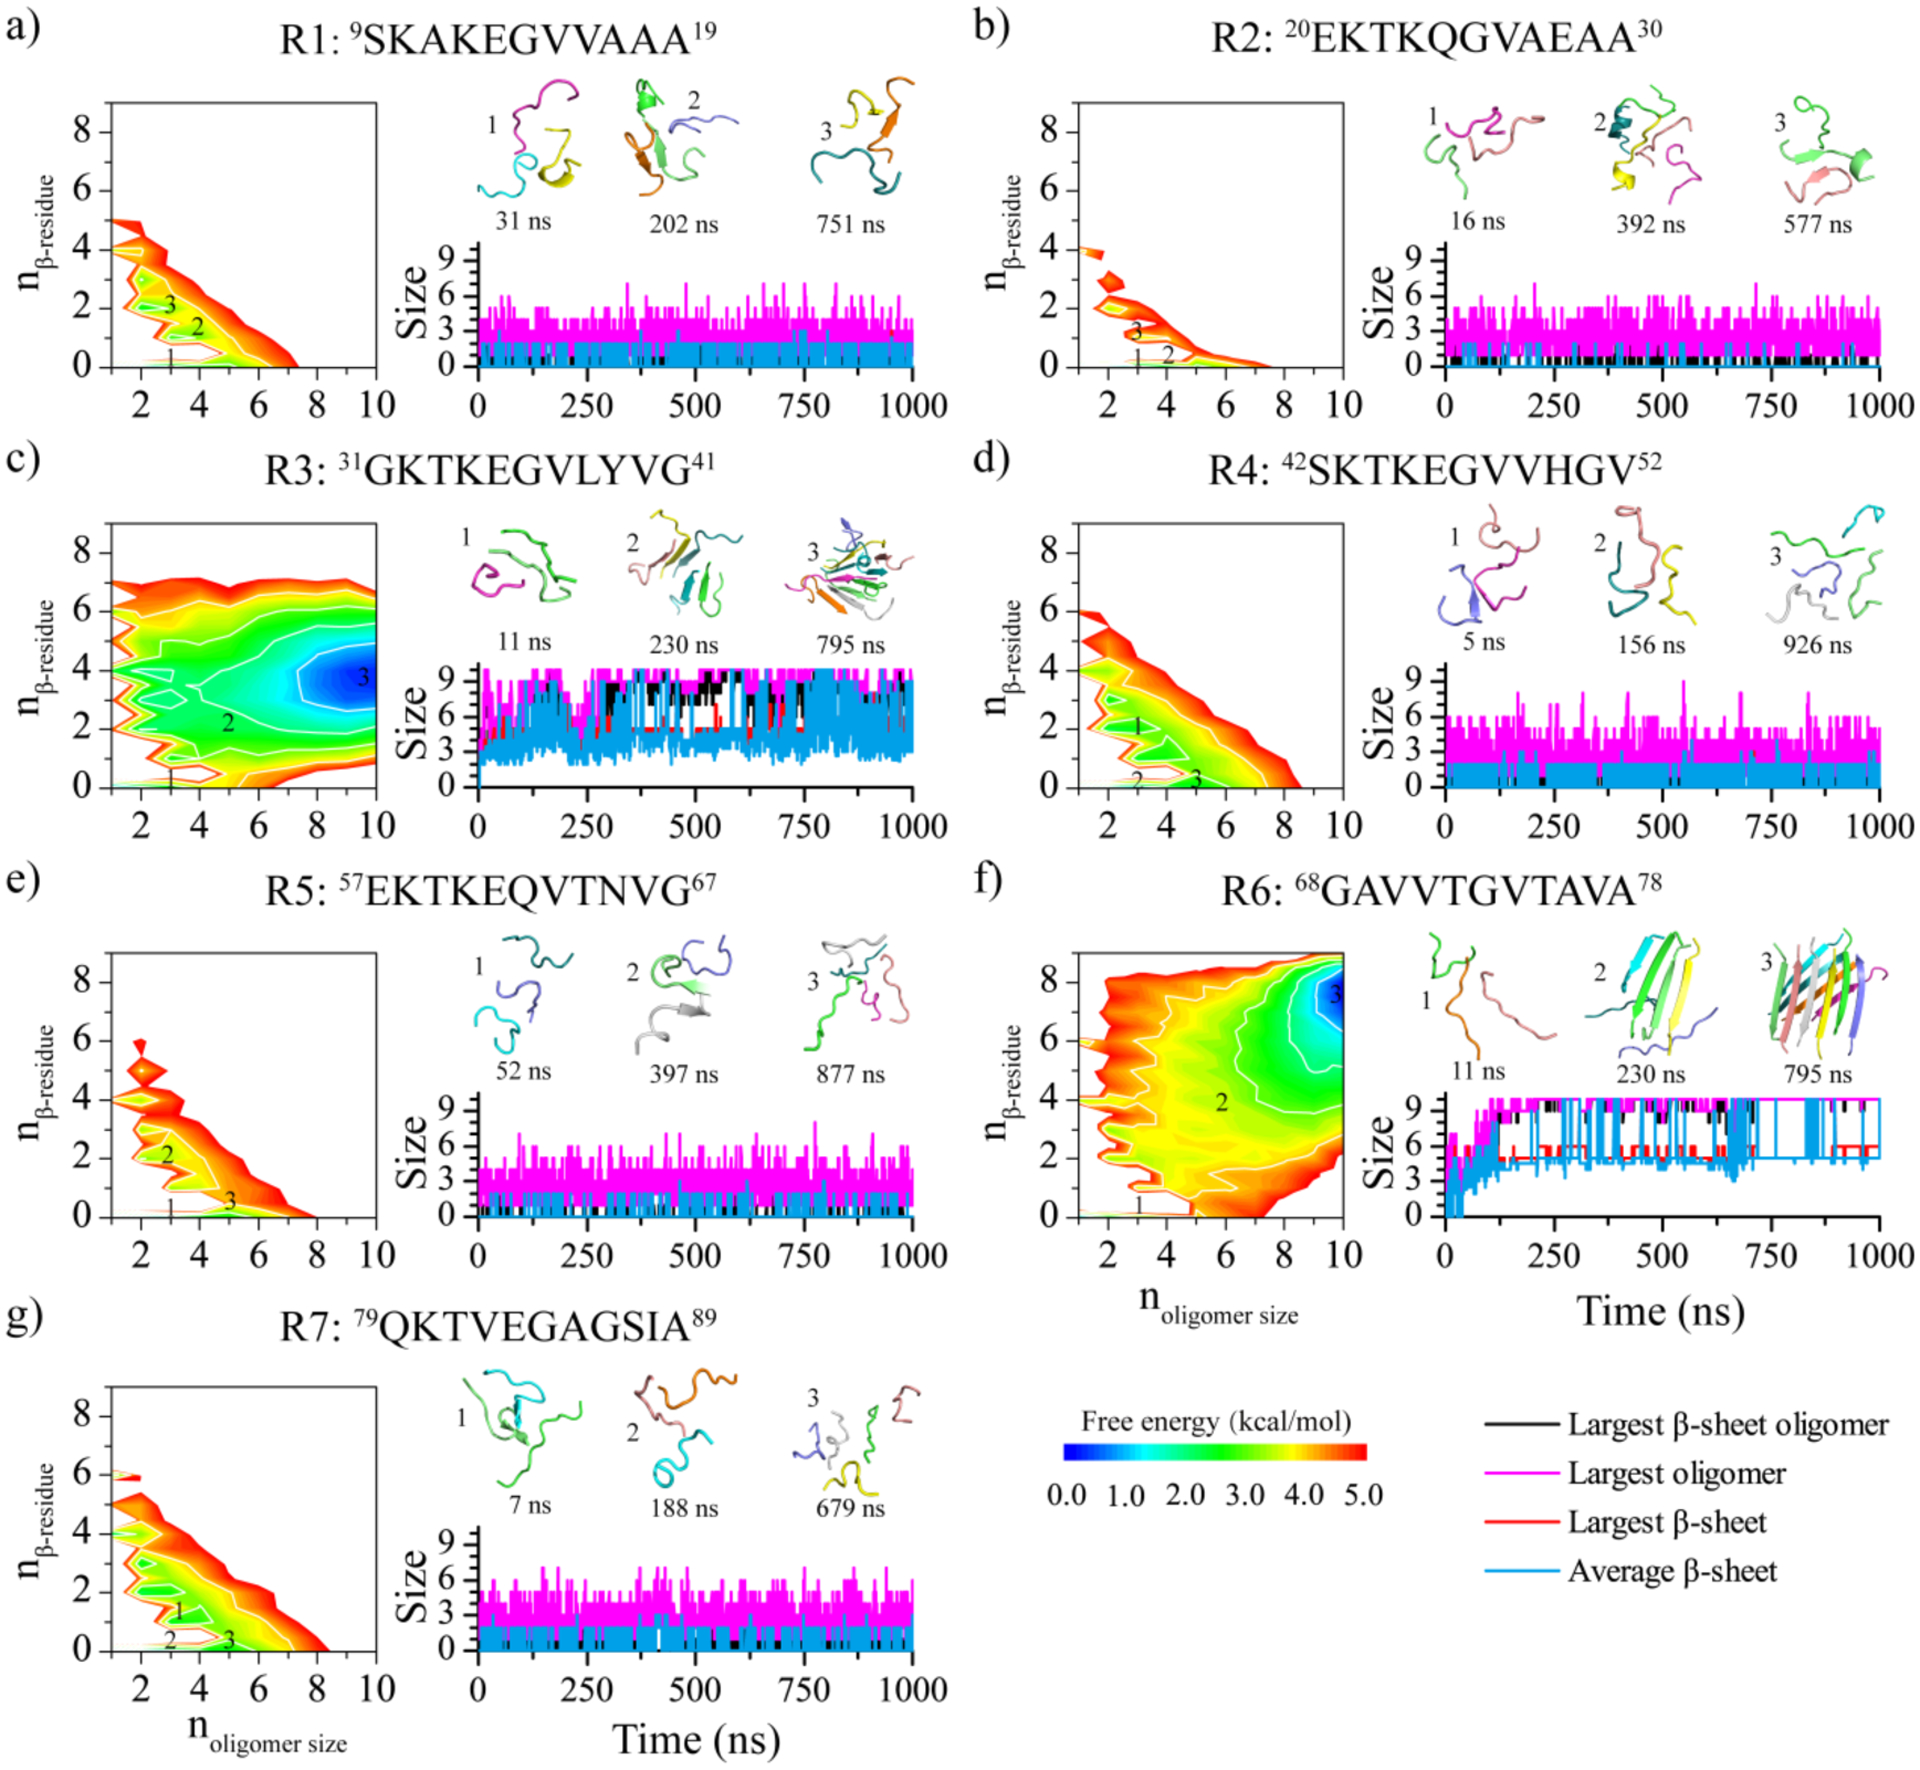
Figure 2. Self-assembly free energy landscape and aggregation conformational dynamics analysis for αS repeats.

The aggregation free energy landscapes for the seven αS repeats a-g) are presented on the left as a function of oligomer size (noligomer size) and the average number of residues per chain adopting the β-sheet conformation (nβ-residue). The whole 1000 ns simulation data from 30 independent DMD trajectories are included to capture all self-assembly conformations during the aggregation process. One trajectory, randomly selected from the 30 independent DMD trajectories, is presented on the right to illustrate the self-assembly conformational dynamics of the corresponding repeat. The self-assembly dynamics are monitored by the time evolution of the largest oligomer size, largest β-sheet oligomer size, largest β-sheet, and average β-sheet. The snapshots along with the assemblies are shown in the inset on the right, and their corresponding states in the free energy landscape are labeled.
