
Figure 3. Equilibrium conformational and structural analyses of the αS repeat assemblies.
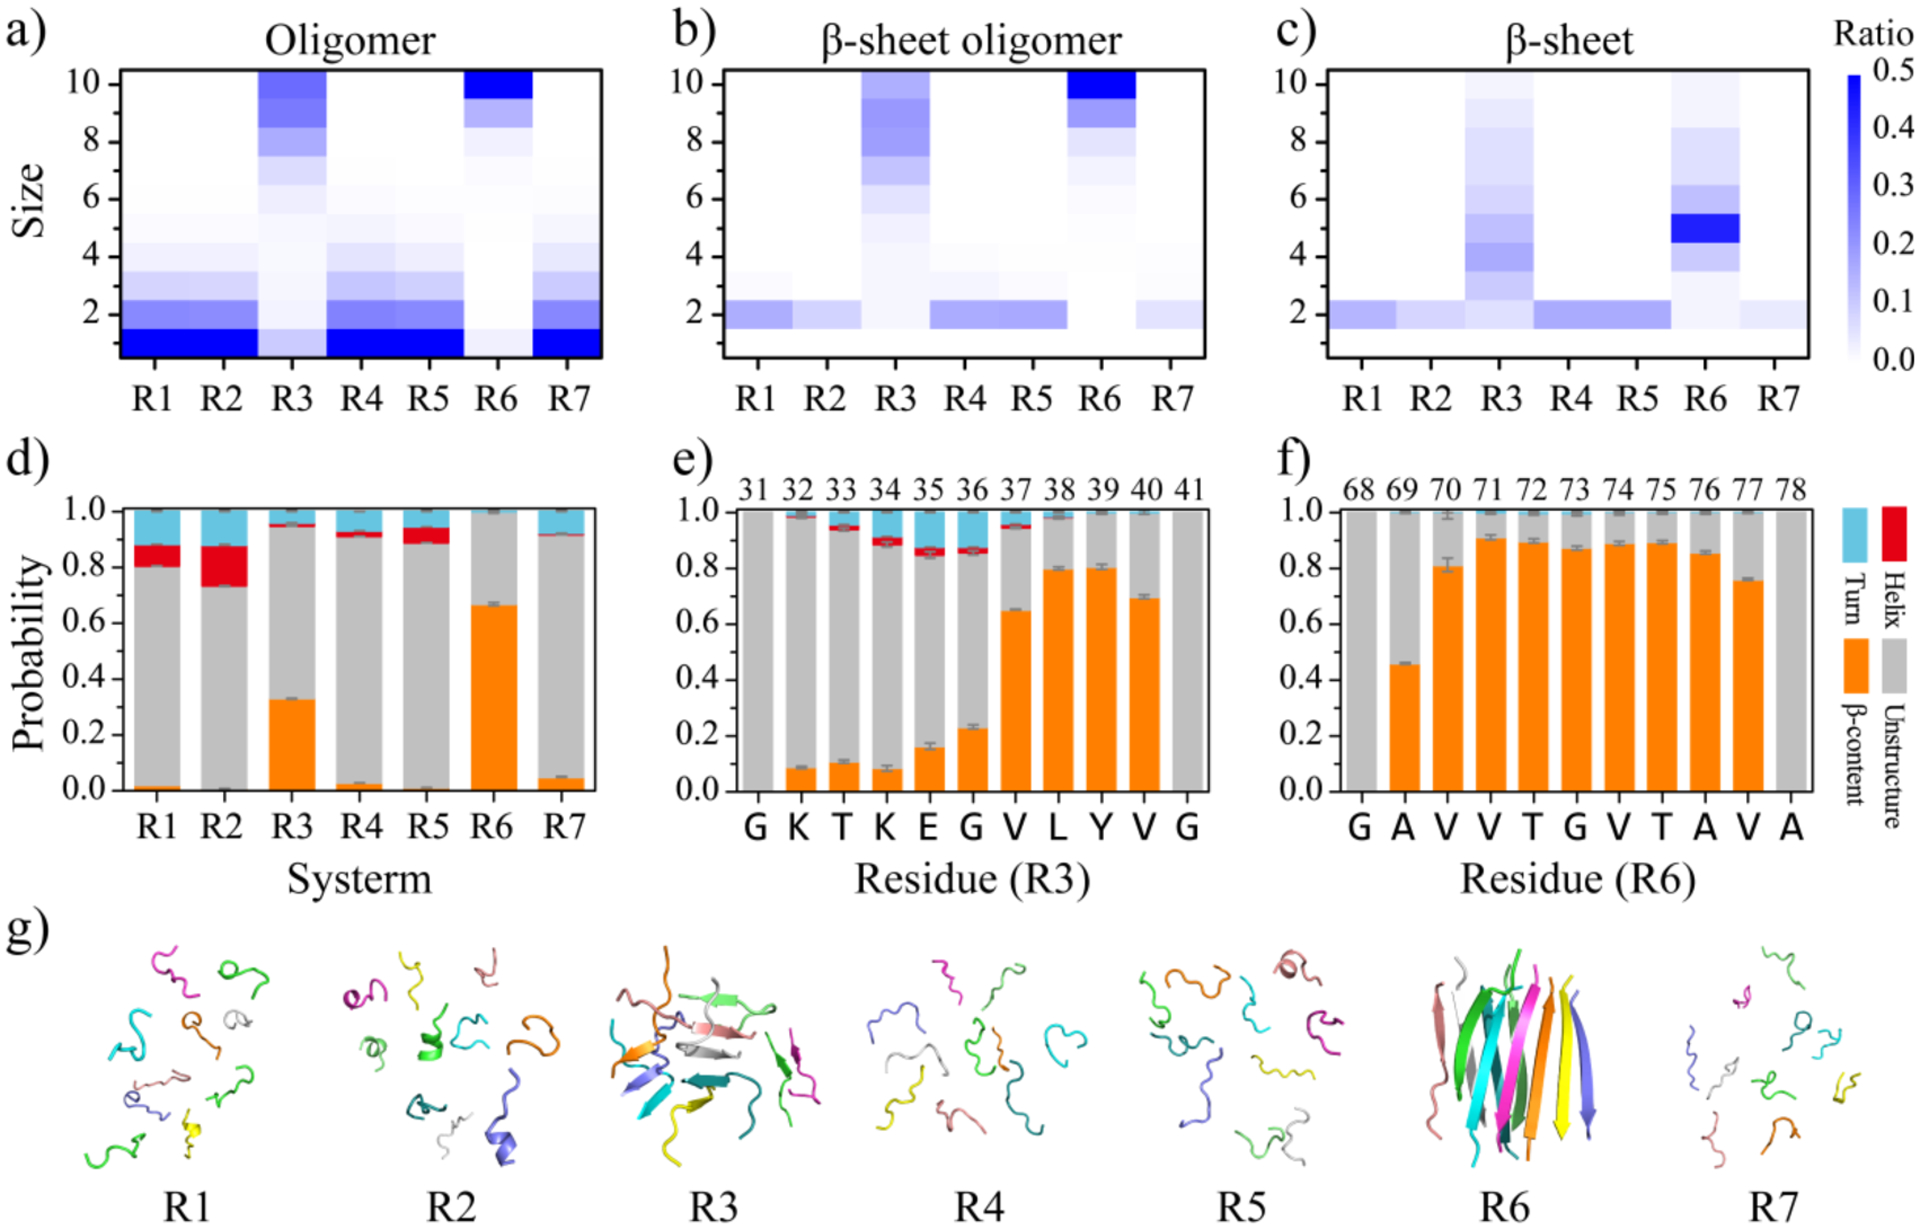
The probability distribution of the oligomer size a), β-sheet oligomer size b), and β-sheet size c) for the self-assemblies formed by each αS repeat are presented. To avoid bias from the initial state, only the conformations of the last 400 ns from all independent simulations are used for the conformational analysis. The average secondary structure contents in terms of unstructured, β-sheet, helix, and turn formations for the aggregates of each αS repeat are shown d). The propensities of each residue to adopt the coil and bend, β-sheet, helix, and turn for the R3 e) and R6 f) repeats are presented. The final snapshot for each repeat, randomly selected from 30 independent DMD trajectories, is also shown g).