
Figure 4. The analysis of β-sheet structures in the self-assemblies of R3 and R6 repeats.
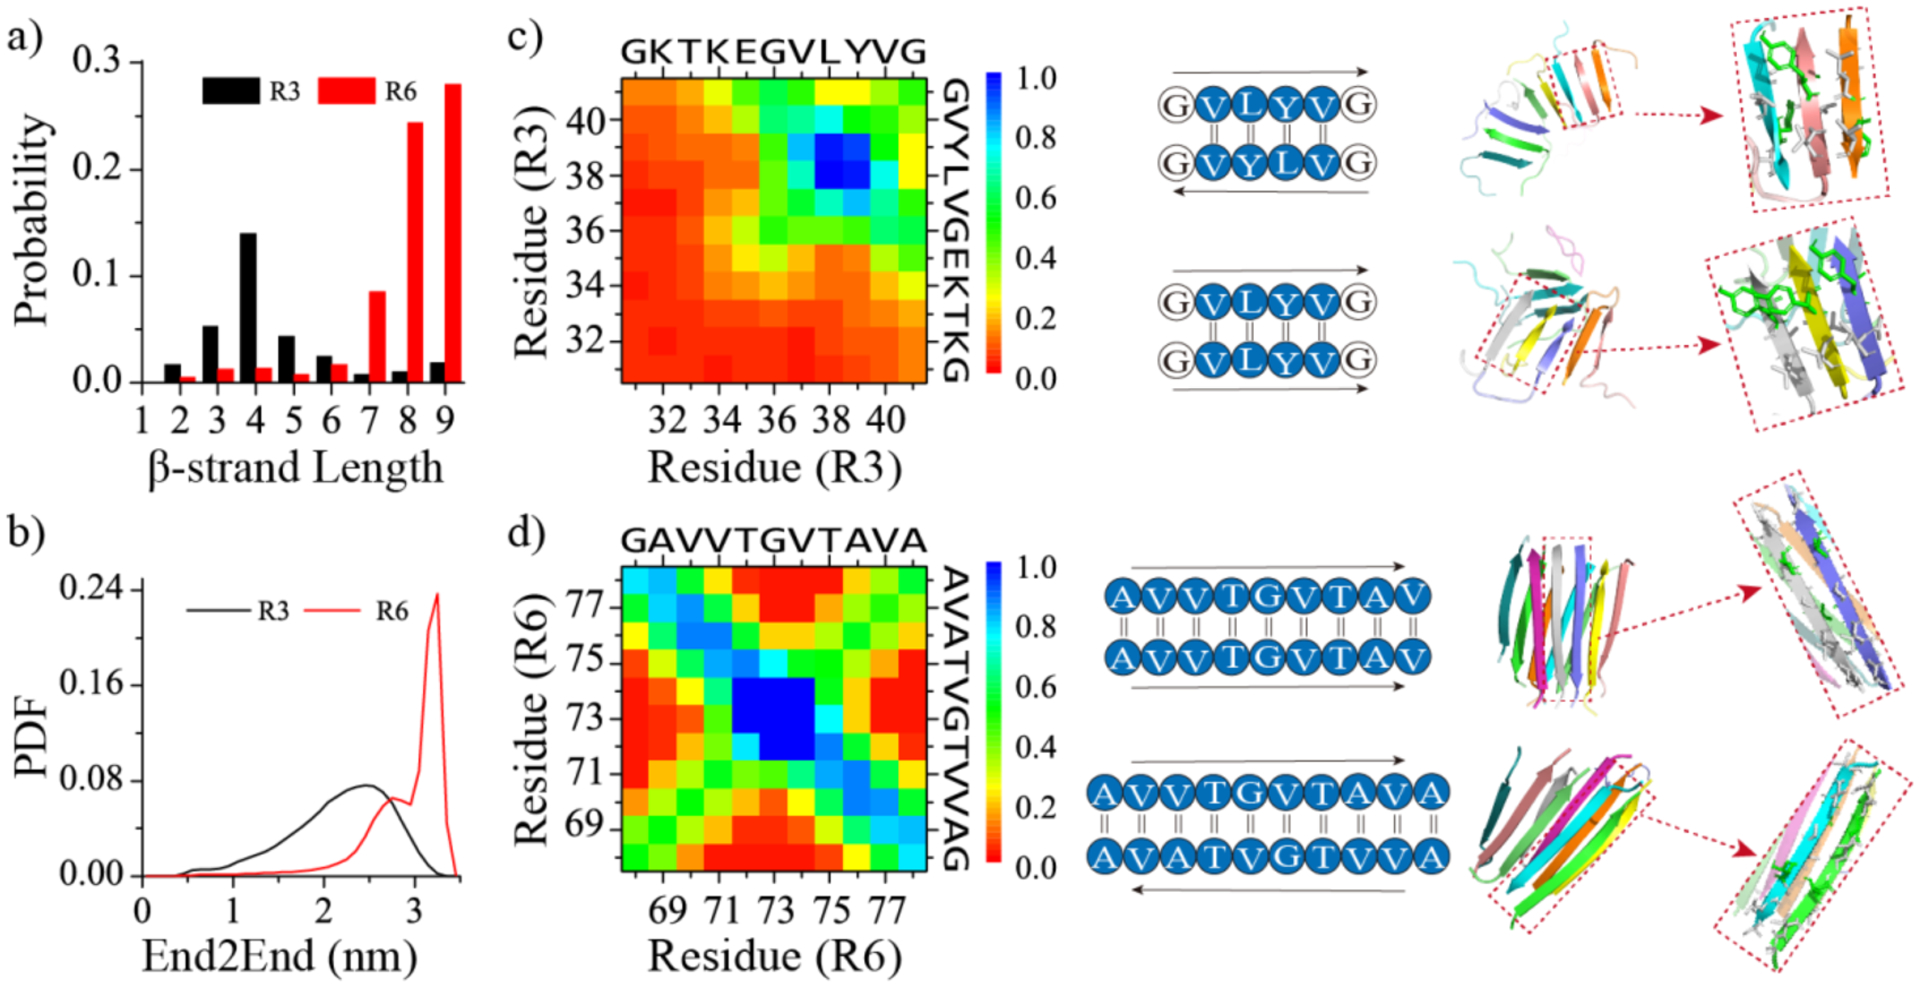
Probability distribution of β-strand length for each peptide within the self-assemblies of R3 and R6 repeats a). Probability distribution of end-to-end (End2End) distances for each R3 and R6 repeat within their aggregates b). Residue-pairwise intermolecular contact frequency maps between main-chain atoms within the self-assemblies of R3 c) and d). Representative parallel and anti-parallel β-sheet contact motifs are shown on the right. Only the last 400 ns of each 1000 ns independent simulation are used for the analysis.