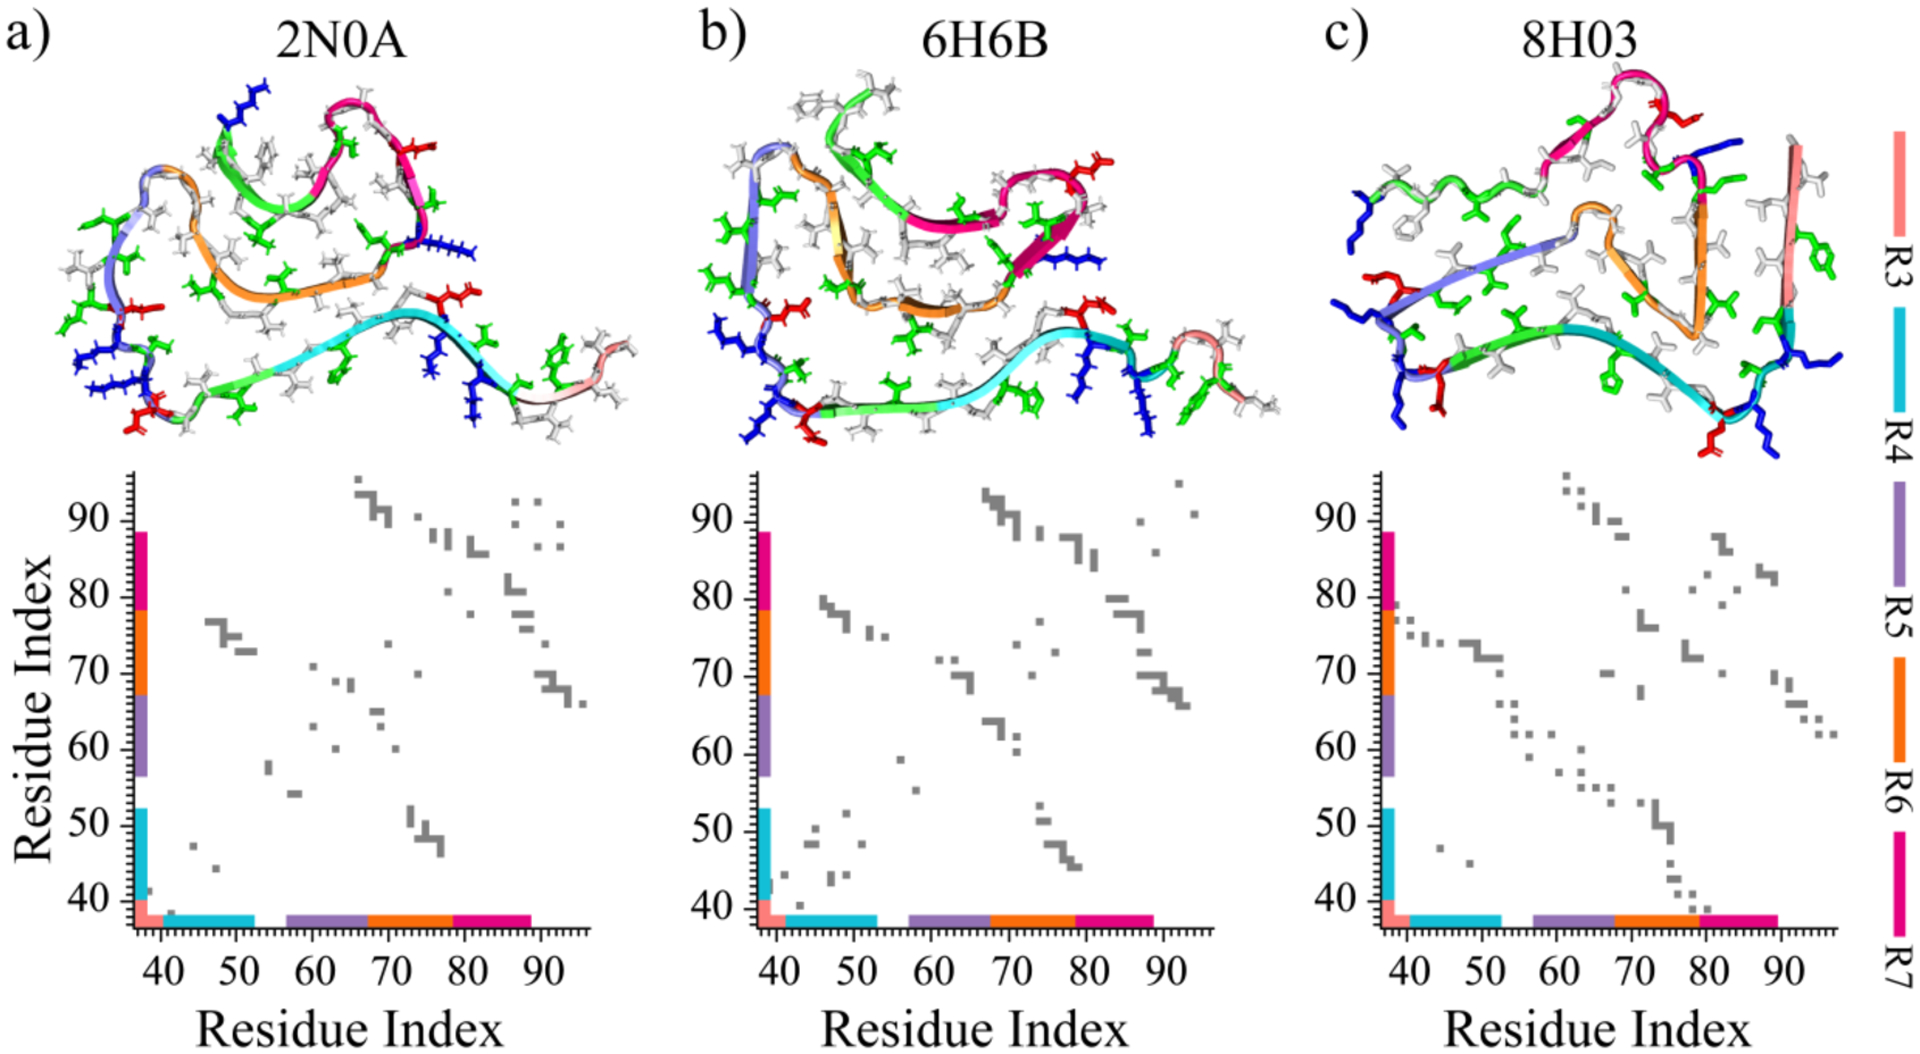
Figure 5. The structures and organization of αS repeats in experimentally determined αS fibrils.

Three representative models of experimentally determined αS fibril structures are presented at the top, with their corresponding intra-peptide contact frequency maps illustrated at the bottom a-c). Each repeat of αS is colored differently in the cartoon for clarity. The side chains of hydrophobic, hydrophilic, negatively charged, and positively charged residues are colored white, green, red, and blue, respectively.
