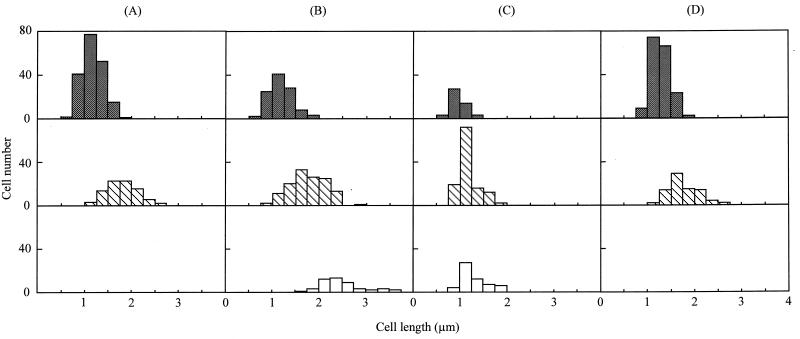
FIG. 5.
Distribution of cell length with inhibition of lipid synthesis. The distribution of cell lengths in cells with one, two, and three or more nucleoids is shown by shaded, hatched, and open bars, respectively. The cells at 0, 1, and 2 h after the transfer into nonsupplemented medium are shown in columns A (n = 273), B (n = 286), and C (n = 234), respectively. The cells at 2 h after transfer into the standard medium are indicated in column D (n = 174). The average lengths of cells in columns A, B, C, and D are 1.37, 1.63, 1.17, and 1.43 μm with SDs of 0.39, 0.57, 0.25, and 0.32 μm, respectively.

