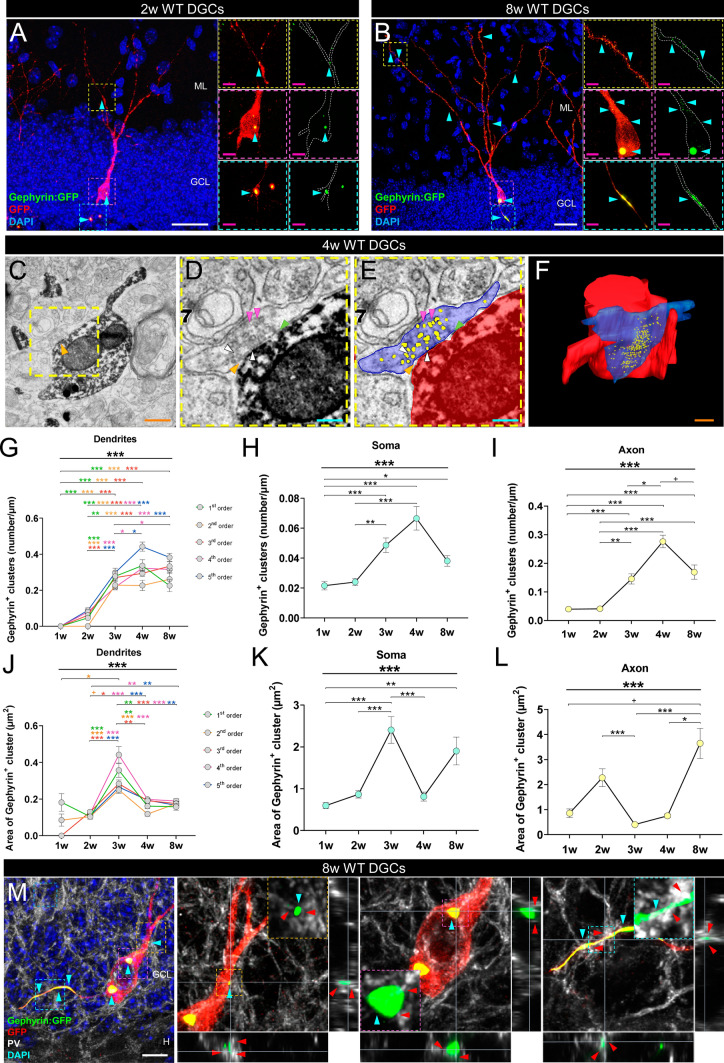
Fig. 1.
Inhibitory innervation of newborn dentate granule cells (DGCs) of wild-type (WT) mice. A, B Representative images of 2- (A) and 8- (B) week-old newborn dentate granule cells transduced with a Gephyrin:GFP-encoding retrovirus. The endogenous fluorescence of the retrovirus (green) enabled visualization of Gephyrin bound to the postsynaptic densities in inhibitory synapses. The use of an anti-GFP antibody (red) enhanced visualization of the intracellular trafficking of the protein and allows visualization of cell morphology [60]. C–F Representative electron microscopy image (C–E) and 3D reconstruction (F) of inhibitory synapses made onto 4-week-old newborn dentate granule cells. G Density (number/µm) of Gephyrin+ clusters in the dendrites of newborn dentate granule cells of distinct ages (1, 2, 3, 4, and 8 weeks post-infection). The density of clusters was evaluated in each dendritic branching order separately. H–I Density (number/µm) of Gephyrin+ clusters in the soma (H) and axon (I) of newborn dentate granule cells of distinct ages. J–L Area of Gephyrin+ clusters in the dendrites (J), soma (K), and axon (L) of newborn dentate granule cells of distinct ages. M Representative image of an 8-week-old newborn dentate granule cell transduced with a Gephyrin:GFP-encoding retrovirus, and high-power magnification of Gephyrin+ clusters surrounded by Parvalbumin (PV)+ terminals together with orthogonal views. In (A, B, and M), Z-projection images are shown. In (G–L), a nonparametric Kruskal–Wallis test, followed by a Dunn post hoc test, was used. In (G, J), a minimum of 30 dendritic segments of each branching order (1st, 2nd, 3rd, 4th, and 5th) per cell age, obtained from 4–5 animals per genotype, were analyzed. At least 30 somas (H, K) and 30 axonal segments (I, L) per cell age, obtained from 4–5 animals per genotype, were analyzed. Graphs represent mean values ± SEM. ML: Molecular layer. GCL: Granule cell layer. H: Hilus. White scale bar: 25 μm. Magenta scale bar: 5 µm. Orange scale bar: 500 nm. Light blue scale bar: 200 nm. Light blue triangles: Gephyrin+ clusters. Orange triangle: inhibitory synapse. White triangles: Readily releasable pool of synaptic vesicles. Magenta triangles: Recycling pool of synaptic vesicles. Green triangles: Synaptic cleft. Red triangles: PV+ terminals. + 0.09 > p ≥ 0.05; * 0.05 > p ≥ 0.01; ** 0.01 > p ≥ 0.001; and *** 0.001 > p ≥ 0.0001

