Fig. 4.
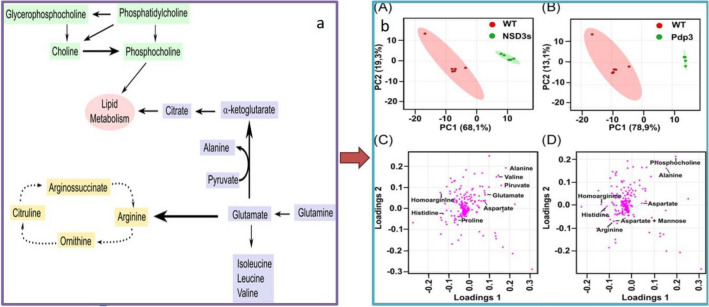
a Metabolic pathways of the major metabolites detected on NSD3s and Pdp3 overexpression. The main metabolites detected belong to glutaminolysis (blue), metabolism of cholines (green), and arginine synthesis (yellow). b NMR metabolomics shows similar metabolic profile on NSD3s or Pdp3 overexpression. PCA score plots show a strong class discrimination between control (WT) replicates (red) and NSD3s overexpression (green) (A), and between control (WT) replicates (red) and Pdp3 overexpression (green) (B). PCA loading plots highlight important metabolites for class discrimination between NSD3s+ and WT, such as glutamate, aspartate, and alanine (C), and between Pdp3+ and WT, such as phosphocholine, aspartate, and alanine (D). NMR nuclear magnetic resonance, WT wild-type.
Reproduced from Rona et al. (2019) with permission

