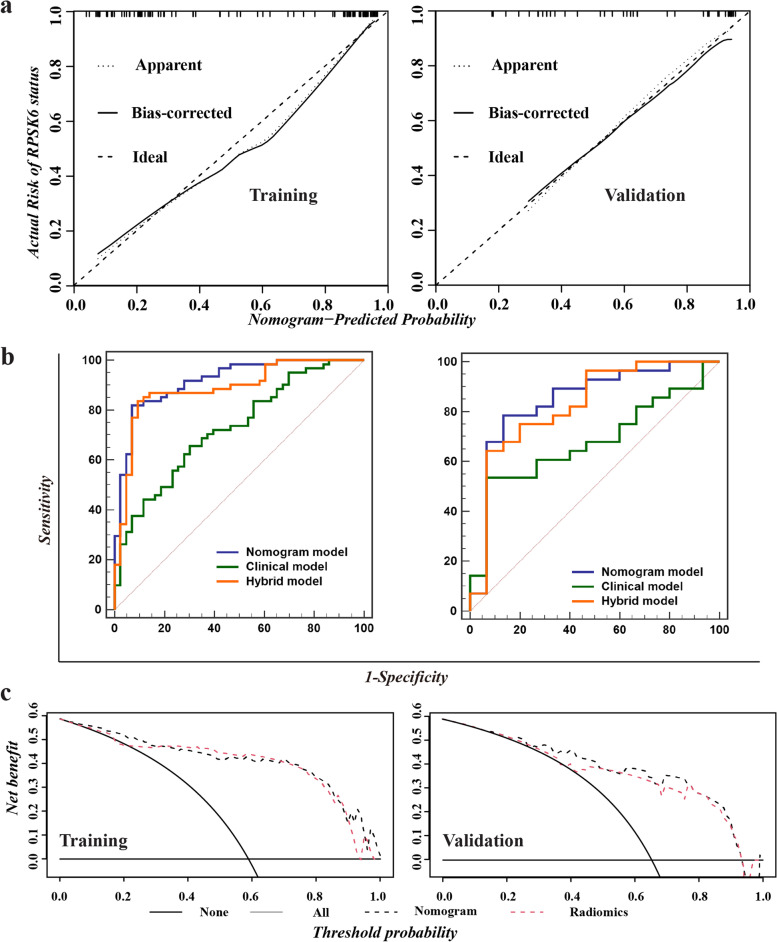
Fig. 3.
Performance comparison of built models and DCA analysis. a Calibration curve in the training and validation cohort. b The comparison of diagnostic ability of clinical model, radiomics model, and nomogram. c The clinical utility of the combined nomogram was evaluated by decision curve analysis (DCA). In the DCA analysis, the black dashed line indicated nomogram, and the red dashed line indicated hybrid radiomics models. In the comparison plot, the blue line indicated nomogram, the orange line indicated hybrid model, and the green line indicated clinical model

