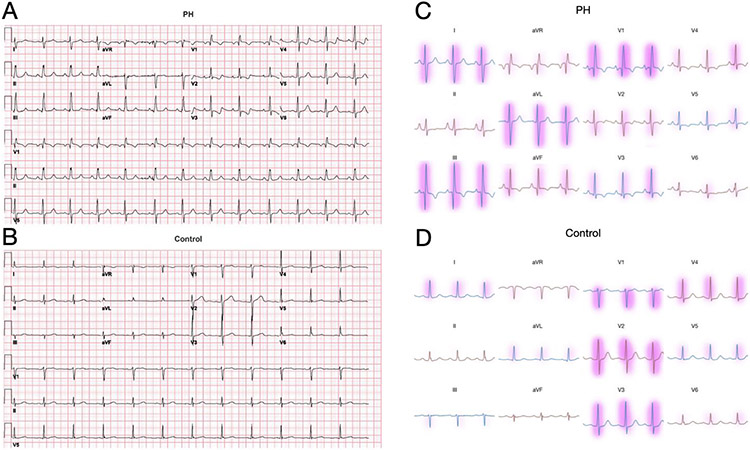
Figure 3.
A,B: Examples of ECG tracings used for algorithm development from an example patient with longstanding PH (top) and a patient without PH (bottom). Note some classic ECG features of PH in (left) including rightward axis and prominent R wave in V1. C,D: Features of the ECG voltages that were important for the model’s classification are highlighted in red, with color intensity corresponding to LIME-derived importance values. ECG, electrocardiogram; PH, pulmonary hypertension

