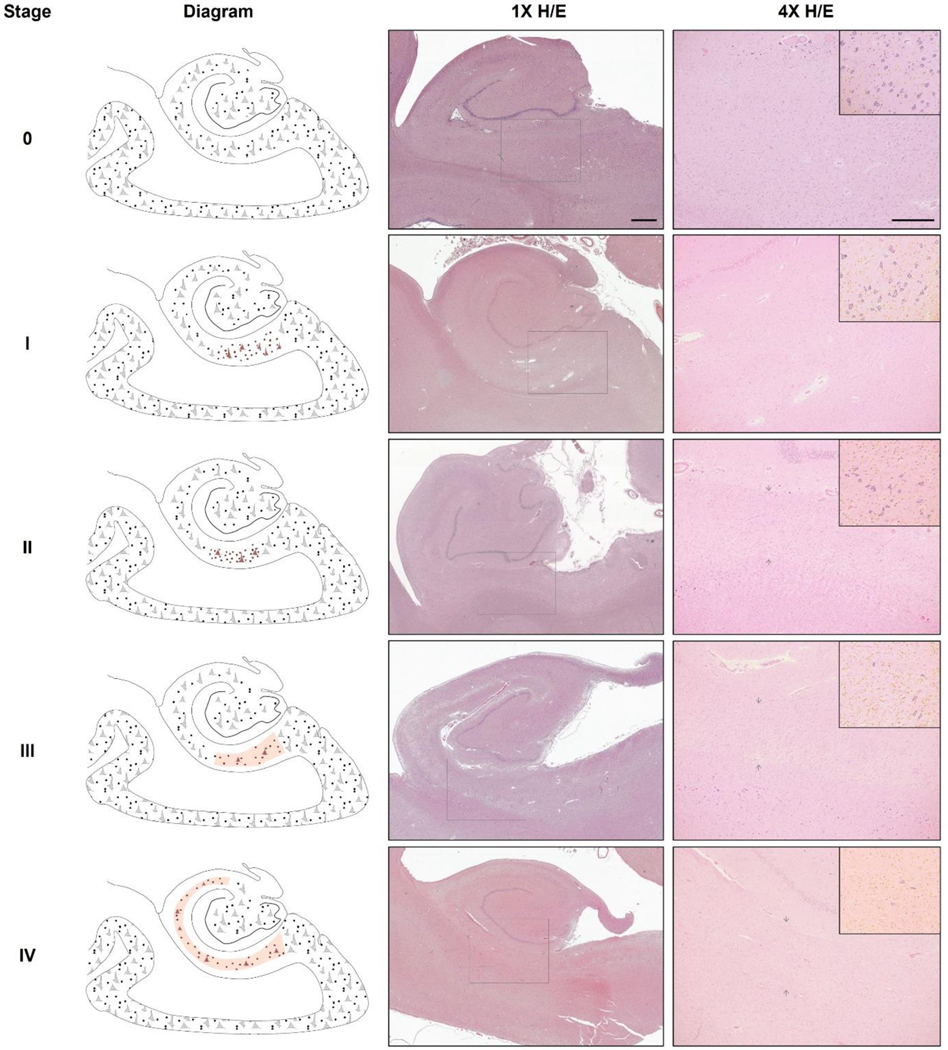
Figure 1. Histological features defining the HS stages within the proposed system.
Left column shows schematic drawings highlighting cellular findings at each stage: stage 0 (no HS), stage I (early cellular phase), stage II (early gliotic phase), stage III (advanced short phase) and stage IV (advanced long phase). The terms “short” and “long” refer to the extent of involvement along the hippocampal transverse axis (red shaded region marks the sclerotic segment). Middle and right columns show example H/E-stained sections of hippocampal body sections at each stage, at 1x (scale bar=1mm) and 4x magnification (scale bar 4x=500μm) respectively. Square within 1x image indicates field enclosed in 4x image. Subsection in top-right corner shows outlines of neurons (dark blue) and non-neuronal cellularity (yellow) to ease their distinction in 4x image. Brightness and color saturation modified to match background color and enhance contrast. Note the shrinkage of the cortex at the CA1-subiculum junction visible in stages II, III and IV (arrows). H/E, hematoxylin/eosin.

