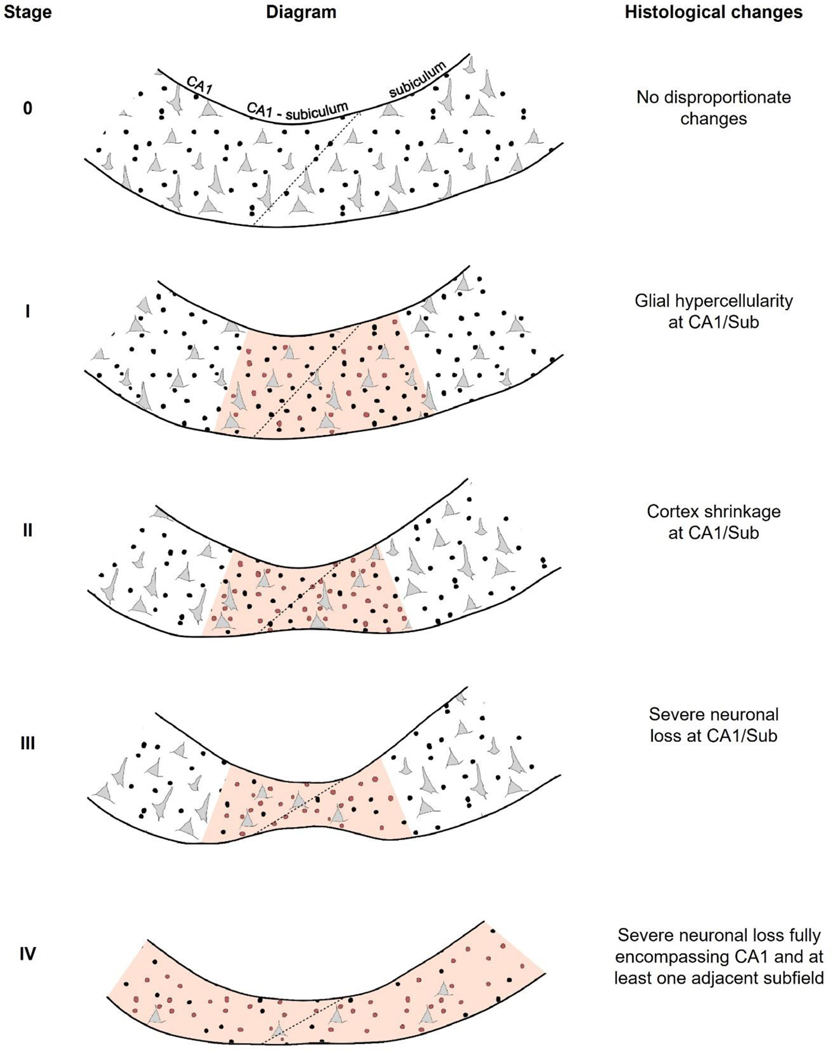
Figure 2. Histological hallmarks of the proposed HS staging system at the CA1-subiculum junction and adjacent regions.
Schematic drawing highlighting changes in glial and neuronal cellularity as well as cortex shrinkage (present in stages II, II and IV of this system). Neurons are indicated with grey triangular shapes, and glia with black circles (with regions showing hypercellularity including red circles). The diagonal transition denoting CA1/Sub is indicated with a dotted line. The affected region that is key for distinguishing each stage is shaded in red: in stages I, II and III, the key affected region is CA1/Sub, while in stage IV sclerosis fully encompasses CA1 and at least one adjacent subfield (CA2 and CA3 are not included in this figure, shown in Fig.1). Right column shows histological changes, referring to features within a given stage that are added to those of the previous stages. At all stages, hallmarks defining each stage include those of previous stages as well. CA1/Sub, CA1-subiculum junction.

