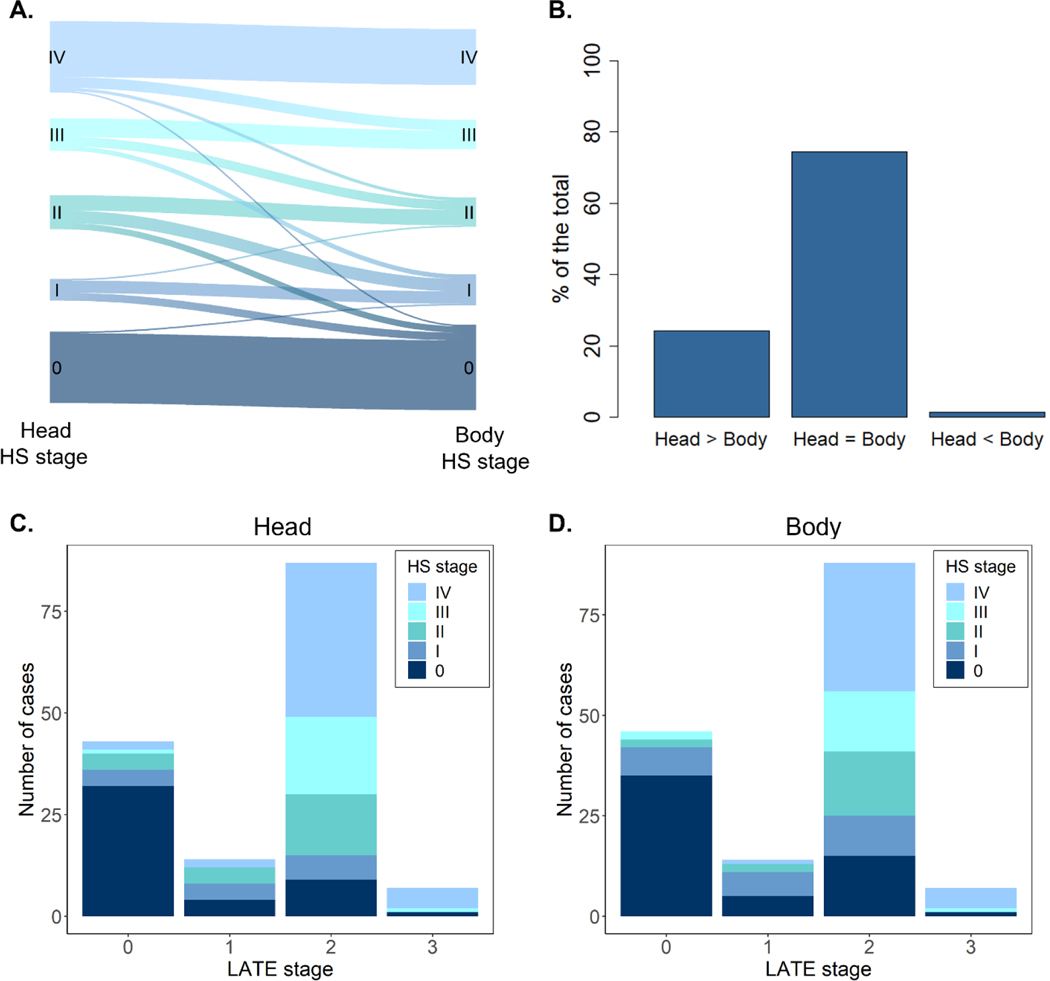
Figure 3. HS pathology distribution and relation to LATE.
A. River-plot showing individual differences in HS stages between the anterior and posterior hippocampal levels assessed (head and body, respectively). B. Percentage of hippocampi displaying equal or different HS stages at the hippocampal head and body. C. Distribution of head HS stages as a function of LATE staging. D. Distribution of body HS stages as a function of LATE staging. HS, hippocampal sclerosis; LATE; limbic age-related TDP-43 encephalopathy.

