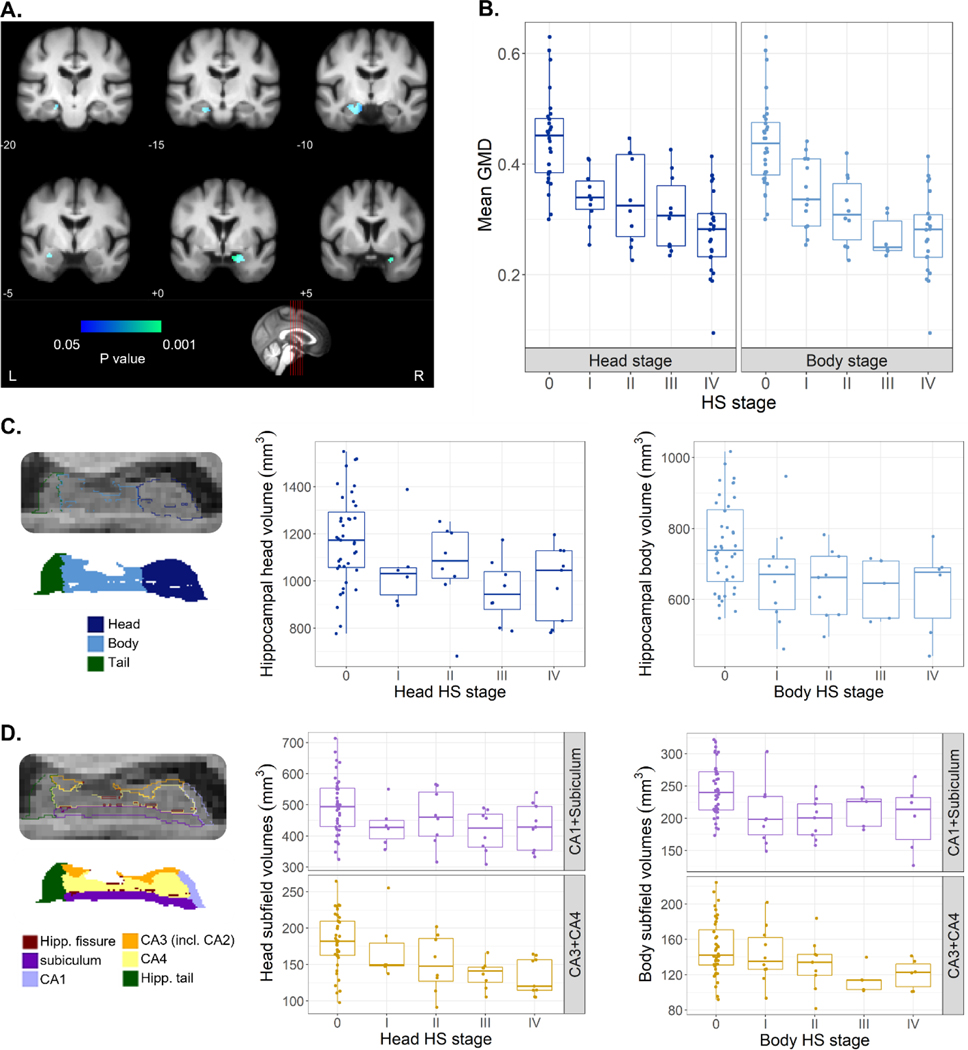
Figure 4. Variation of grey matter density and volume measures derived from MRI as a function HS staging.
A. Voxel-based morphometry results of GMD as a function of the average among head and body HS stages. Effects surviving correction for multiple comparisons (Family Wise Error correction, P<.05) overlayed with an in-house template built from scans of elderly subjects, with MNI coordinates provided below each coronal section. Colormap indicates the P value of the correlation between regional-specific grey matter density and HS stage. B. Mean grey matter density values at the cluster of significant effects shown in A, as a function of HS stages at the head and body of the hippocampus. C. Volumes of hippocampal head and body as a function of respective HS stages. Head volumes displayed a significant variation as a function of HS stage. Left panel shows example segmentation labels for head, body, and tail of the hippocampus at 0.33mm resolution in sagittal view. D. Volume of grouped subfields (CA1+Subiculum, CA3+CA4) at hippocampal head and body, the former showing a significant variation with HS stage. Left panel shows example subfield labels resulting from segmentation at 0.33mm resolution in sagittal view. GMD, grey matter density; Hipp., hippocampal; HS, hippocampal sclerosis; incl., including; L, left; R, right.

