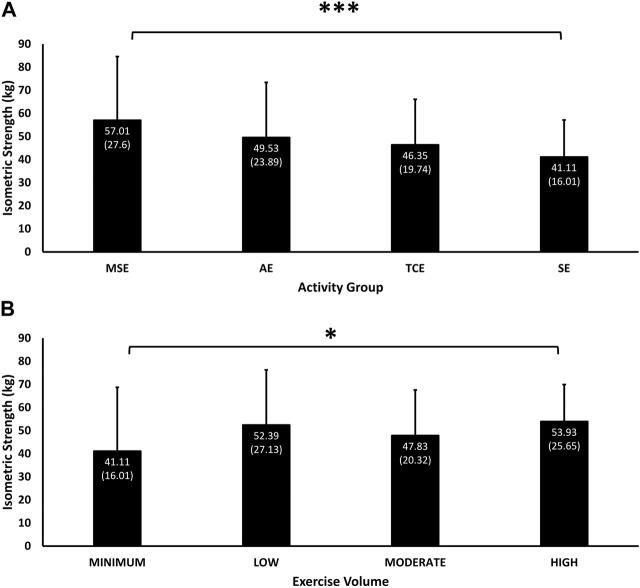
FIGURE 3.
Mean (SD) of performance in isometric strength according to experimental groups (A) and exercise volumes (B). Significant main effect of Group (p = 0.01) and interaction effect of Group and Exercise Volume (p < 0.001). * = p < 0.05, and *** = p < 0.001 significant difference in pairwise comparisons between MSE and SE group (p = 0.001), and between the “High” than the “Low” exercise volumes (p = 0.019).

