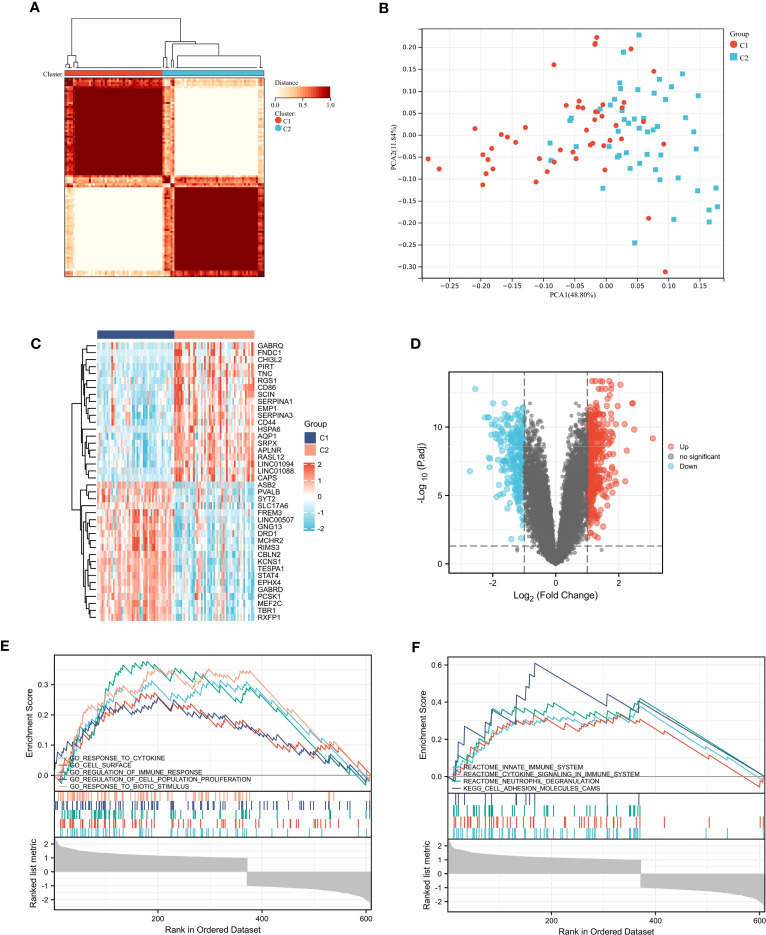
Figure 5.
Consensus clustering analysis. (A) Defined two clusters and the consensus matrix heat map of their related regions. (B) PCA analysis showed transcriptome differences between the two subtypes. (C, D) The heat map and volcano map between cluster C1 and cluster C2. (E, F) Five representative enriched GO gene sets and KEGG pathways from GSEA.

