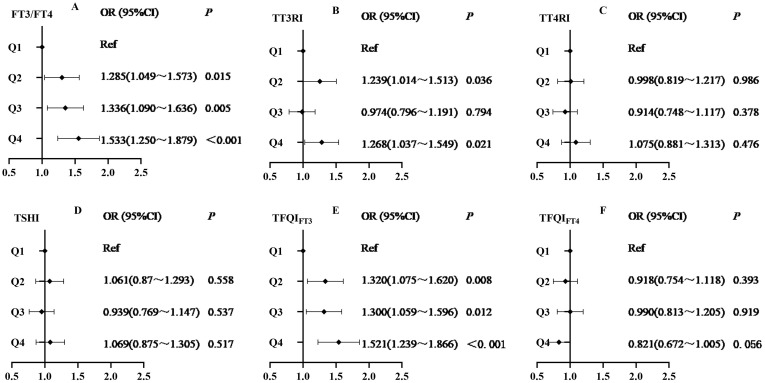
Figure 3.
Logistic regression analysis of relationship between sensitivity indices to thyroid hormones quartiles and the risk of MAFLD (A) FT3/FT4 quartiles, (B) TT3RI quartiles, (C) TT4RI quartiles, (D) TSHI quartiles, (E) TFQIFT3 quartiles, (F) TFQIFT4 quartiles. The model was adjusted for age, gender, WC, BMI, SBP, DBP, TC, TG, LDL-C, HDL-C, FPG, BUN, SUA, Scr, AST and ALT.

