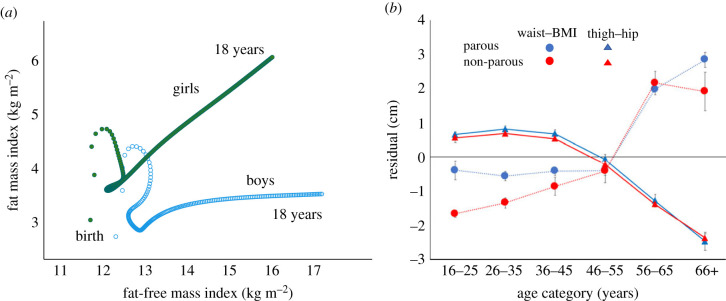
Figure 3.
Age and sex variability in human body composition. (a) Fat mass index plotted against fat-free mass index from birth to 18 years, using the 50th centile of UK reference data [64,65]. Fatness is high in infancy, then declines before increasing again in mid-childhood, though with increasing sexual dimorphism. (b) Variability in fat distribution in Thai women. Residuals from regressing waist girth on BMI, and thigh girth on hip girth, are plotted against age group for parous and non-parous women. In both groups, waist-BMI increases and thigh–hip declines with age, indicating redistribution of body fat, though the data are cross-sectional. Data from the National Sizing Survey of Thailand. Redrawn with permission [78]. (Online version in colour.)

