
Figure 3.
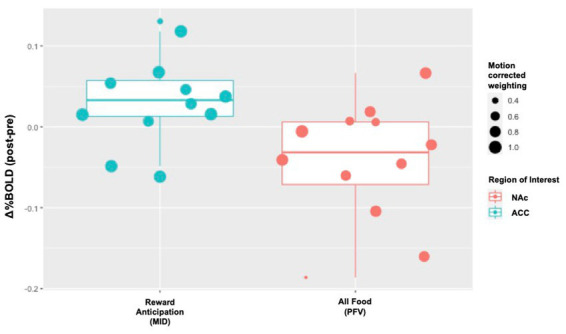
Individual-level Δ%BOLD following opioid antagonism. The boxplots display individual-level data points that represent the raw values of Δ%BOLD. The size of the data point corresponds with the amount of uncensored data for that individual (e., 1.0 means 100% of the data for that individual were uncensored; 0.8 means 80% of that individual’s data were uncensored and 20% censored due to motion). Following naltrexone, increased activity was seen in the anterior cingulate cortex, ACC, during reward anticipation (Cohen’s d 1.25, p = 0.086). Following naltrexone, reduced activity was seen in the nucleus accumbens, NAc, during passive food view task (Cohen’s d − 1.06, p = 0.048).