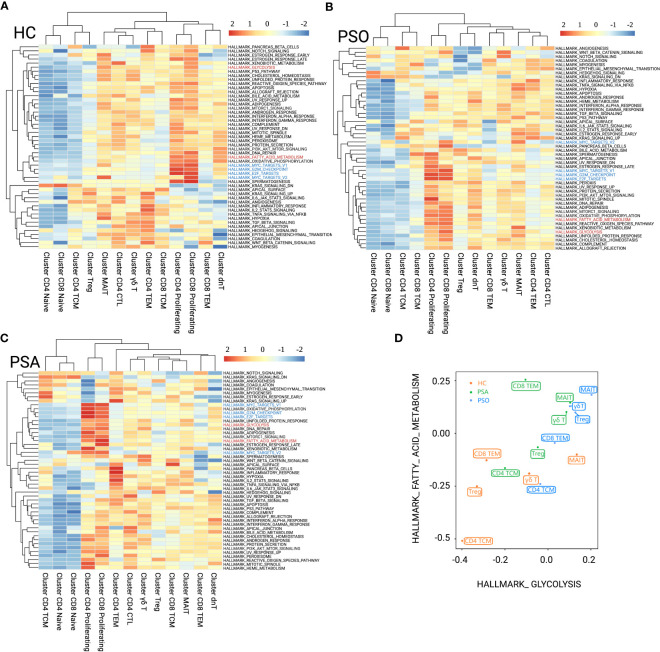
Figure 2.
GSVA (HALLMARK) analysis for immunometabolic patterns of T-cell clusters in HC (A), PSO (B), and PSA (C). The focused metabolic gene sets are highlighted in red, and the cycle-related gene sets are highlighted in blue. (D) Patterns of fatty acid metabolism and glycolysis gene sets performed among T-cell subsets of group HC, PSO, and PSA based on GSVA scores.

