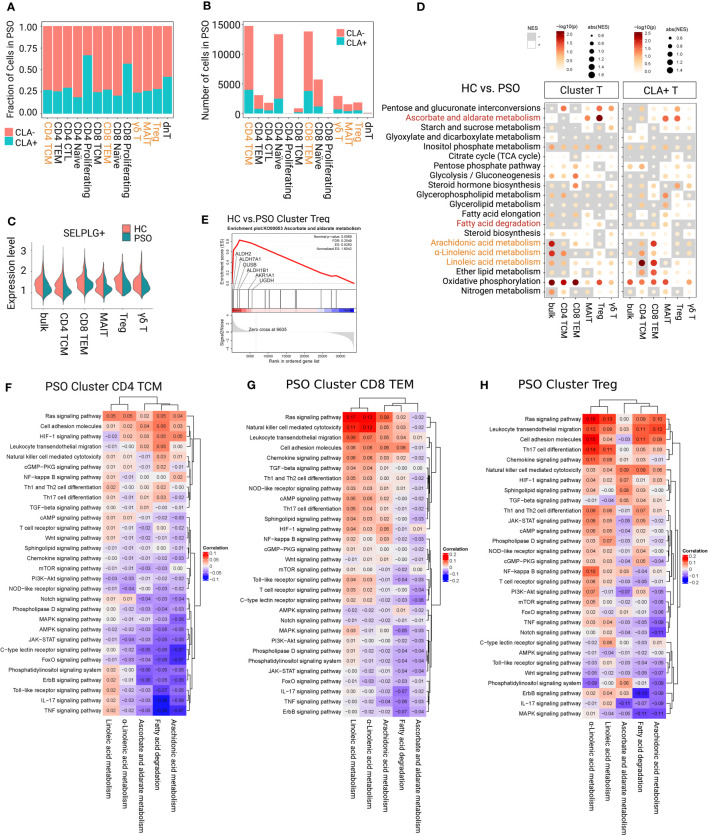
Figure 3.
Determining immunometabolic pathways in T-cell subsets of PSO. (A, B) Fraction and number of CLA+ and CLA- subfractions. (C) The gene expression value of SELPLG showed only a weakly-expressed peak in each focused subset of PSO. (D) Metabolic difference landscape of focused subsets between PSO and HC at the levels of Cluster and CLA+ by GSEA. Gray background indicates a negative normalized enrichment score (NES), and the bright background indicates a positive NES. The NES reflects the degree to which a gene set is downregulated (negative NES) or upregulated (positive NES). The area of the dot corresponds to the NES absolute value. The color of the dots corresponds to the P value. (E) GSEA showed an obvious increase of ascorbate and aldarate metabolism in Tregs of PSO. Immunometabolic linkage between metabolic pathways of α-linolenic acid metabolism, linoleic acid metabolism, arachidonic acid metabolism, ascorbate and aldarate metabolism, or fatty acid degradation and immune events in CD4+ TCMs (F), CD8+ TEMs (G), and Tregs (H) of PSO at the level of Cluster.

