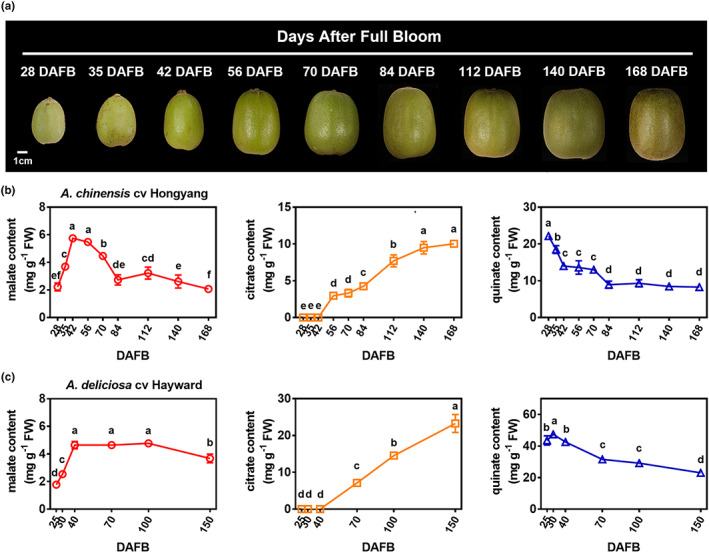
Figure 1.

Dynamic profiles of organic acids during the development of kiwifruit. (a) Nine developmental stages of Actinidia chinensis cv Hongyang. DAFB, days after full bloom. Bar = 1 cm. (b) Citrate, malate and quinate content during the developmental stages of Actinidia chinensis cv Hongyang. (c) Citrate, malate and quinate content during the developmental stages of Actinidia deliciosa cv Hayward. Each value represents mean (±SE) of three biological replicates. Different letters indicate significant differences at P < 0.05 determined by one‐way analysis of variance (ANOVA) testing.
