Figure 3.

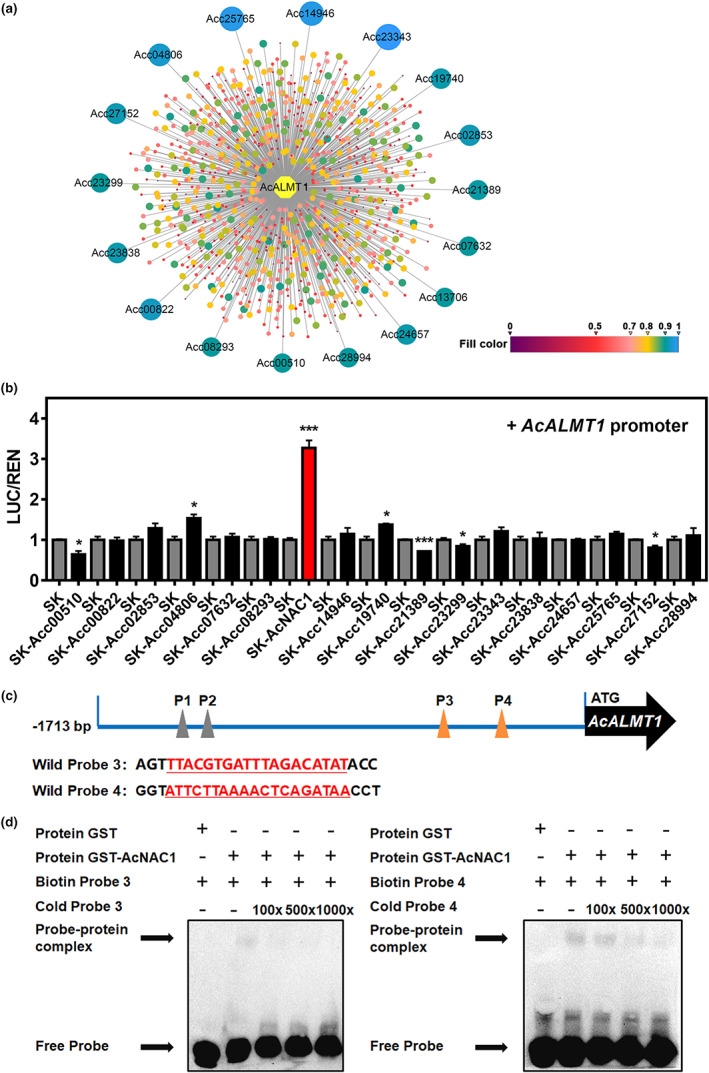
The regulatory effect of AcNAC1 on the AcALMT1 promoter. (a) Transcriptional regulatory network of AcALMT1. The network includes 961 transcription factors (TFs). Circles with different colours represent different TFs, the 17 TFs which labelled with Acc ID (Pilkington et al., 2018) represent correlations higher than 0.9. The colour scale for correlation between AcALMT1 and TFs ranged from 0 to 1. (b) The regulatory effect of AcNAC1 on AcALMT1 promoter using dual‐luciferase assays. The LUC/REN value of empty vector (SK) was set as 1. The red column highlights the effects of AcNAC1. Error bars indicate SE from five biological replicates (*P < 0.05; **P < 0.01; ***P < 0.001). (c) Oligonucleotides used for electrophoretic mobility shift assays (EMSA) with the 19‐bp NAC core sequences are underlined and marked in red. (d) EMSAs of AcNAC1 bindings to the AcALMT1 promoter. The AcNAC1 protein‐DNA complexes were separated on 6% native polyacrylamide gels. ‘−’ and ‘+’ represent absence and presence, respectively. The concentrations of cold probe were set at 100‐fold, 500‐fold and 1000‐fold excess over labelled probes.
