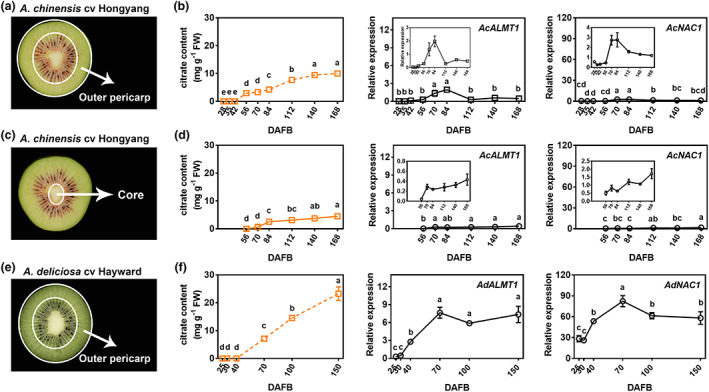
Figure 4.

Citrate content and ALMT1/NAC1 expression patterns in different kiwifruit cultivars and tissues. (a) Transverse sections of A. chinensis cv Hongyang fruit. The tissues between the two white oval are defined as outer pericarp. (b) Citrate contents and AcNAC1/AcALMT1 relative expression of outer pericarp during the development of ‘Hongyang’ fruit. DAFB, days after full bloom. (c) Transverse sections of A. chinensis cv Hongyang fruit. The tissues inside the small white oval are defined as core. (d) Citrate contents and AcNAC1/AcALMT1 relative expression of core during the development of ‘Hongyang’ fruit. (e) Transverse sections of A. deliciosa cv Hayward fruit. The tissues between the two white oval are defined as outer pericarp. (f) Citrate contents and AdNAC1/AdALMT1 relative expression levels of outer pericarp during the development of ‘Hayward’ fruit. The dotted line diagram in (b) and (f) indicates that it has been shown in Figure 1. Each value represents mean ± SE of three biological replicates. The statistical analysis was performed using one‐way analysis of variance (ANOVA) testing.
