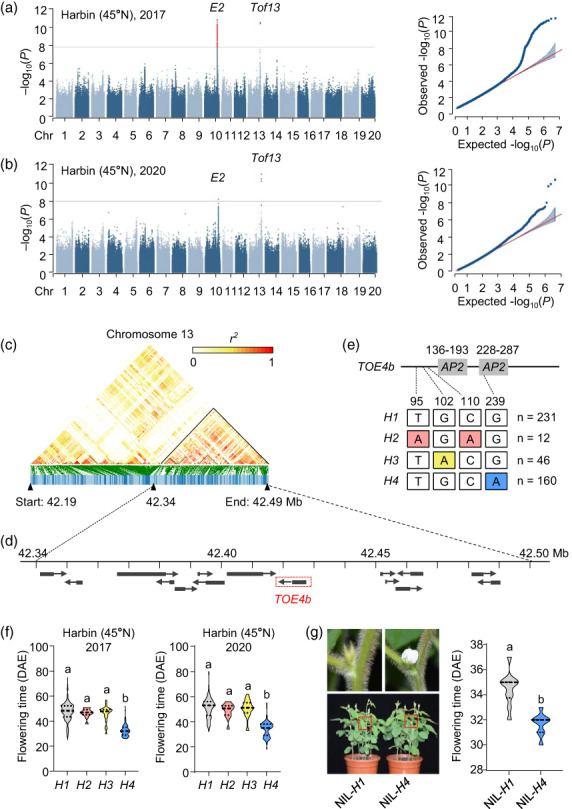
Figure 1.

Identification and analysis of major flowering time loci in soybean. (a, b) Manhattan plot for GWAS and quantile–quantile plots using flowering time collected in Harbin, China, in 2017 (a) and 2020 (b). (c) Linkage disequilibrium analysis of SNPs surrounding Tof13. (d) Schematic diagram of the 150‐kb candidate region showing 15 predicted genes. Black boxes represent the location of genes, and arrows represent the direction of transcription. The red box indicates the candidate gene TOE4b. (e) Summary of the main haplotypes for the candidate gene TOE4b (Tof13). The above panel indicates TOE4b gene structure diagram, the numbers on the top indicate the amino acid location of the two AP2 domains. The below panel indicates the position of the amino acid corresponding to the allelic variations and the number of variations in the 449 accessions. (f) Flowering time associated with the four haplotypes at TOE4b. Data are means ± SD, P < 0.05, as determined by multiple comparison testing by one‐way ANOVA. Data are from 449 accessions grown in Harbin (45°55′ N) in 2017 and 2020 (a, b, f). (g) Flowering time phenotypes of TOE4b near isogenic line (NIL) harbouring the H1 or H4 haplotype, grown in the plant growth chamber under LD conditions (16‐h light/8‐h dark). Flowering time, scored at the R1 stage (days from emergence to the appearance of the first open flower on 50% of the plants). Data are means ± SD, n = 10, P < 0.05, two‐tailed Student's t‐test. DAE, days after emergence. Different lowercase letters indicate significant differences.
