
FIGURE 3.
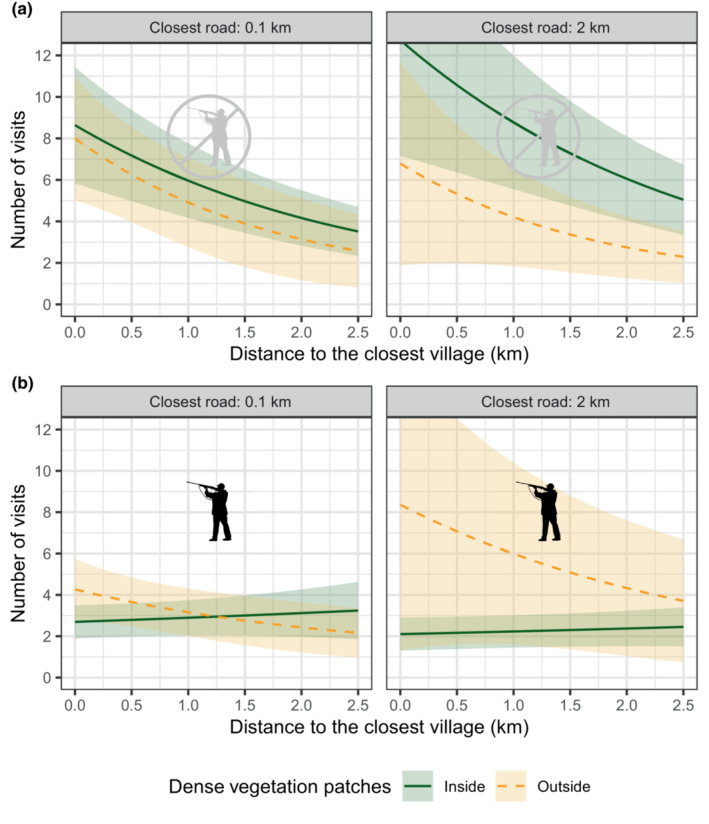
Estimation of the number of visits to resting sites over a 6‐month period, during the non‐hunting season (a) and the hunting season (b), for different distances to roads and villages. The estimation for the resting sites located inside densely vegetated patches is represented in a dark green, solid line. The estimation for the resting sites located outside those patches is represented in a yellow, dashed line. Lightly colored ribbons show the 95% confidence intervals.