
FIGURE 3.
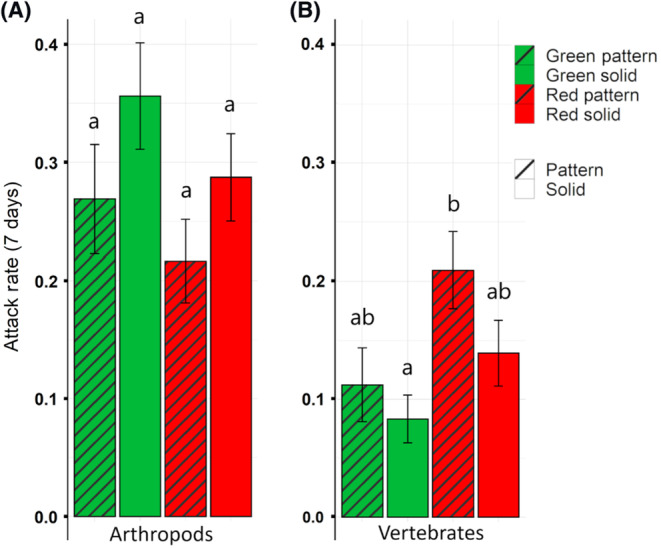
Arthropod and vertebrate attack rates by prey model treatment. Attack rates (mean ± SE) by arthropods (A) and vertebrates (B) on the four artificial prey model treatments (green pattern, green solid, red pattern, red solid) averaged over all trials and sites. Vertebrates had significantly higher attack rates on red patched prey models than on green solid prey models. Bars labeled with the same letters represent no significant statistical difference while bars with different letters represent statistically significant differences.