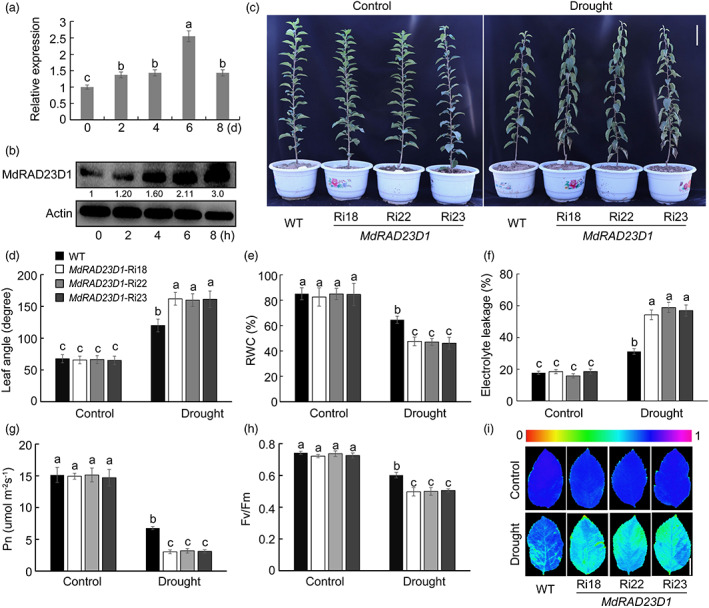
Figure 1.

Expression patterns of MdRAD23D1 and response of MdRAD23D1 transgenic plants to drought. (a) The expression level of MdRAD23D1 under drought stress. qPCR was carried out using the GL‐3 apple (Malus domestica) leaves after drought treatment. (b) MdRAD23D1 levels under drought stress. 200 mm mannitol was applied to the ‘Orin’ apple (M. domestica) calli to monitor drought stress. The calli samples were collected at 0, 2, 4, 6, and 8 h, and a specifically synthesized anti‐MdRAD23D1 antibody was used to detect MdRAD23D1 protein levels. MdActin was used as the loading control. The amount of MdRAD23D1 was quantified using an Ultra‐sensitive multifunctional imager (Uvitec), and the protein level at 0 h was set to 1. (c) Morphology differences of WT and transgenic apple plants under control and drought conditions. Forty‐five‐day‐old WT and MdRAD23D1‐Ri plants in the greenhouse were withheld from water for 8 days. The scale bar = 8 cm. (d–i) Leaf angle (d), relative water content (e), electrolyte leakage (f), Net photosynthesis (Pn) (g), Fv/Fm ratio (h), and chlorophyll fluorescence images (i) in WT and transgenic plants with and without drought treatment. The scale bar in (i) = 3 cm. WT, wild type, here we used GL‐3 apple (M. domestic), which was also used as explants in generating transgenic apple plants; MdRAD23D1‐Ri18/22/23: transgenic apple plants with suppressed expression of MdRAD23D1 via RNA‐interference. Data are shown as the means ± SD. Different letters indicate significant differences according to the one‐way ANOVA followed by Tukey's multiple range test (P < 0.05).
