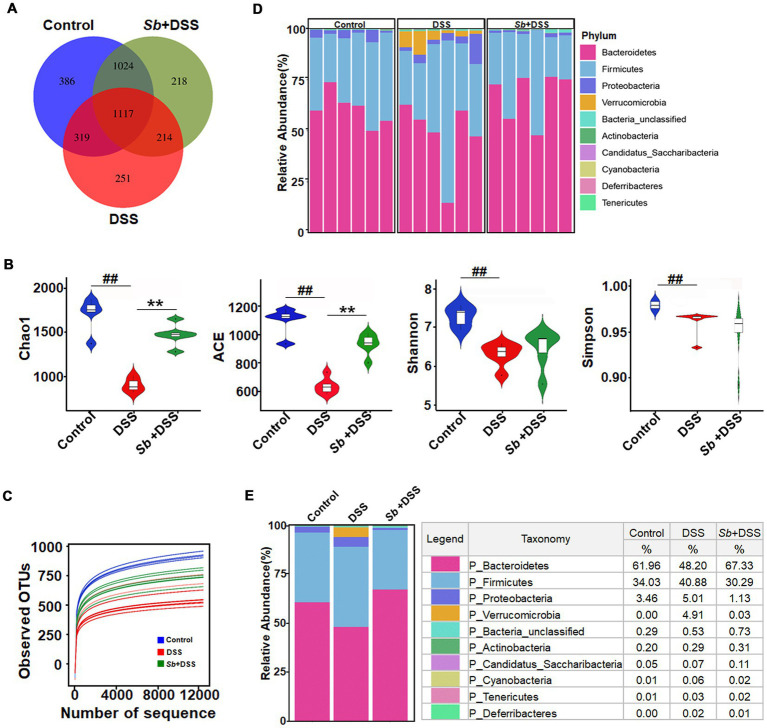
Figure 2.
Impact of S. boulardii administration on intestinal microbiota in DSS-induced colitis mice. (A) A Venn diagram showing the overlap of the OTUs identified in the intestinal microbiota among three groups. (B) α-diversity indexes of gut microbiota among three groups. (C) The rarefaction curve of the observed OTUs. (D,E) Gut microbial pattern at the phylum level within (D) and among (E) the control, DSS and (Sb + DSS) groups were assessed using 16S high throughput sequencing. Blue-, Red-, and green-shaded areas represent the control, DSS and Sb + DSS samples, respectively. n = 6 per group. ##p < 0.01 compared with the control group; **p < 0.01 compared with the DSS group. Sb, S. boulardii.

