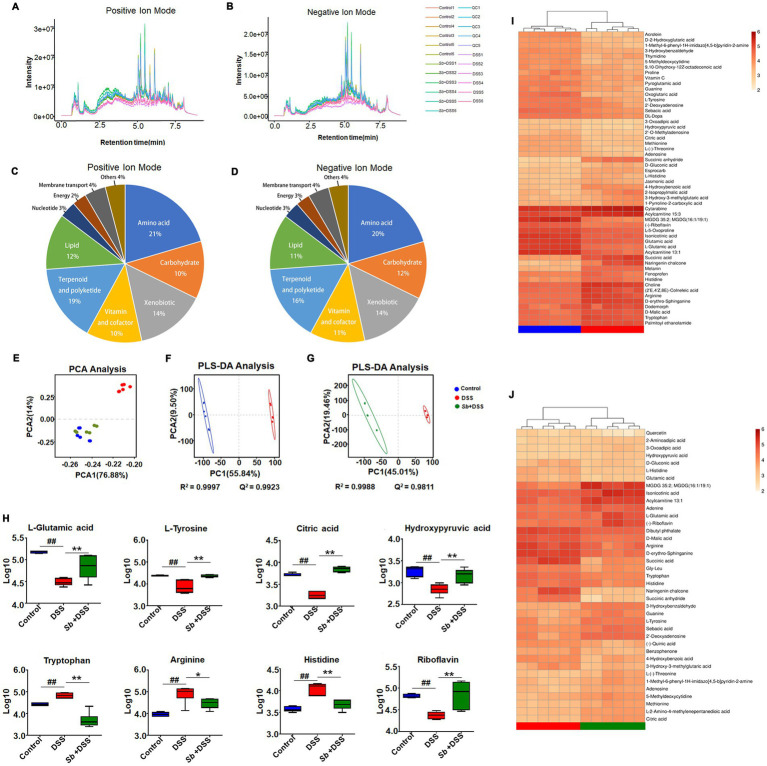
Figure 4.
S. boulardii altered DSS-induced colitis metabolomic profiles. Total ion current LC–MS chromatogram in positive modern (A) and in negative modern (B). Pie chart of the classification of the identified metabolites in positive ion mode (C) and negative ion mode (D). PCA score plot of (C) samples and QC, (D) Control, Sb + DSS and DSS groups. (E) PCA plot of three groups. (F) PLS-DA results for the control group and DSS group. (G) PLS-DA results for DSS group and S. boulardii + DSS group. Each dot or triangle represents the fecal metabolomic profile of a single sample. (H) Box plot visualizations of the relative abundances of the representative metabolites. The bottom and top boundaries of each box indicate the 25th and 75th percentiles, respectively; the horizontal line inside the box is the median; the bottom and top error bars indicate the 10th and 90th percentiles. Heatmap presentation of differential metabolites between (I) DSS vs. control, (J) S. boulardii + DSS vs. DSS groups. n = 6 for each group. ##p < 0.01 compared with the control group; *p < 0.05 and **p < 0.01 compared with the DSS group. Sb, S. boulardii.

