
Fig. 3.
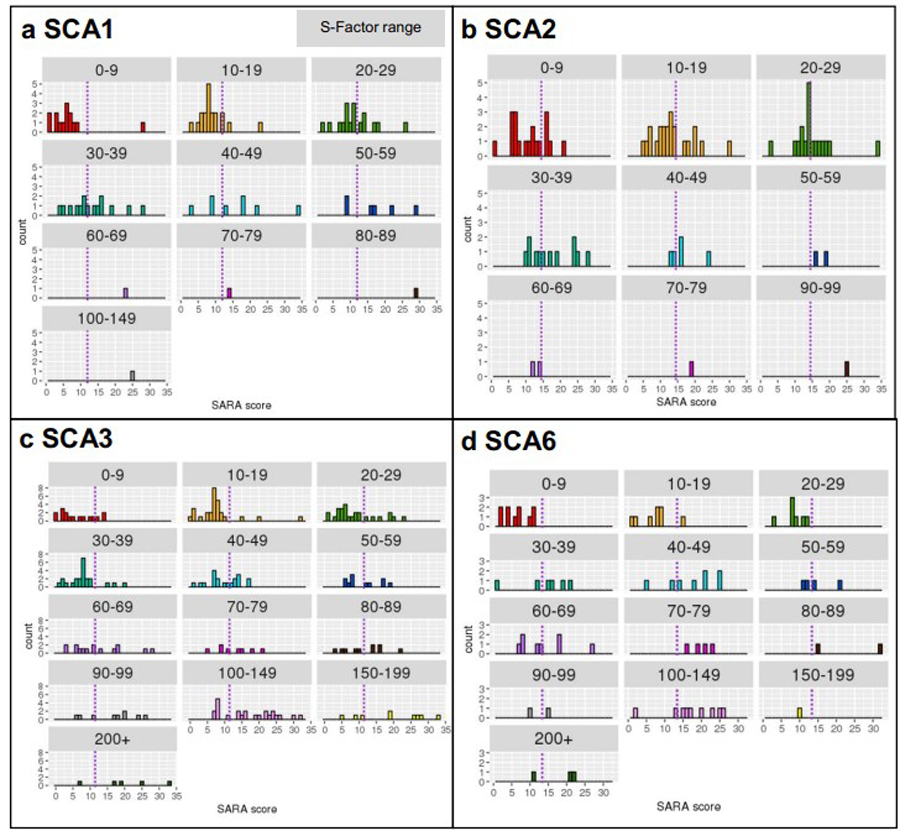
SARA distribution by S-Factor bin (represented by the cells), within (a) SCA1, (b) SCA2, (c) SCA3, and (d) SCA6. The purple dashed line represents the mean SARA score within each SCA type
Official websites use .gov
A
.gov website belongs to an official
government organization in the United States.
Secure .gov websites use HTTPS
A lock (
) or https:// means you've safely
connected to the .gov website. Share sensitive
information only on official, secure websites.
SARA distribution by S-Factor bin (represented by the cells), within (a) SCA1, (b) SCA2, (c) SCA3, and (d) SCA6. The purple dashed line represents the mean SARA score within each SCA type