
Fig. 7.
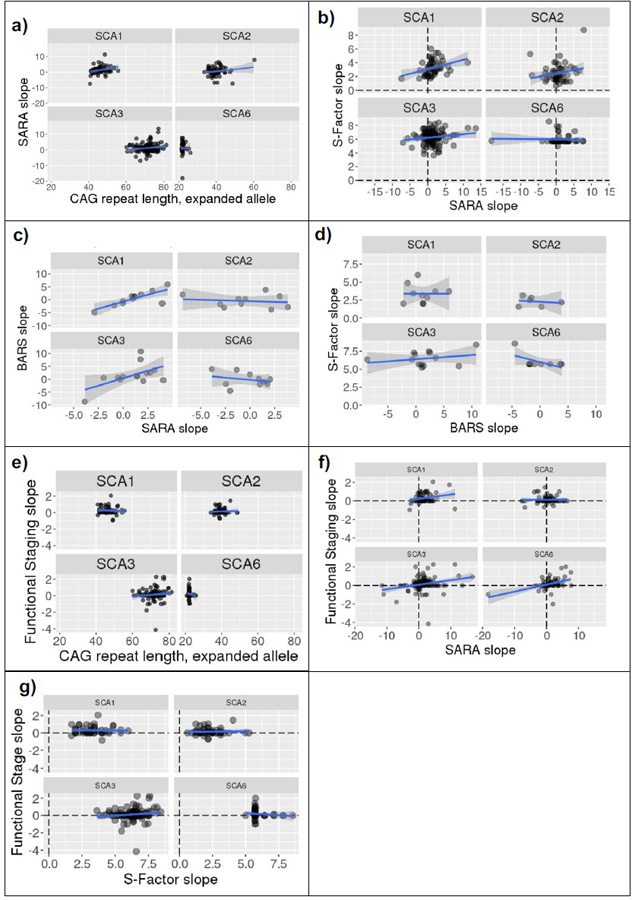
Correlations, split by SCA types, between (a) CAG repeat expansion length and SARA slope (annual change in SARA); (b) SARA slope and S-Factor slope; (c) BARS slope and SARA slope; (d) BARS slope and S-Factor slope; (e) CAG repeat expansion length and Functional Staging slope; (f) Functional Staging slope and SARA slope; (h) Functional Staging slope and S-Factor slope. Linear model line shown in blue with 95% confidence interval in gray. Note that extreme SARA slope values are accounted for by short follow-up durations (see Figure 9)