
FIGURE 4.
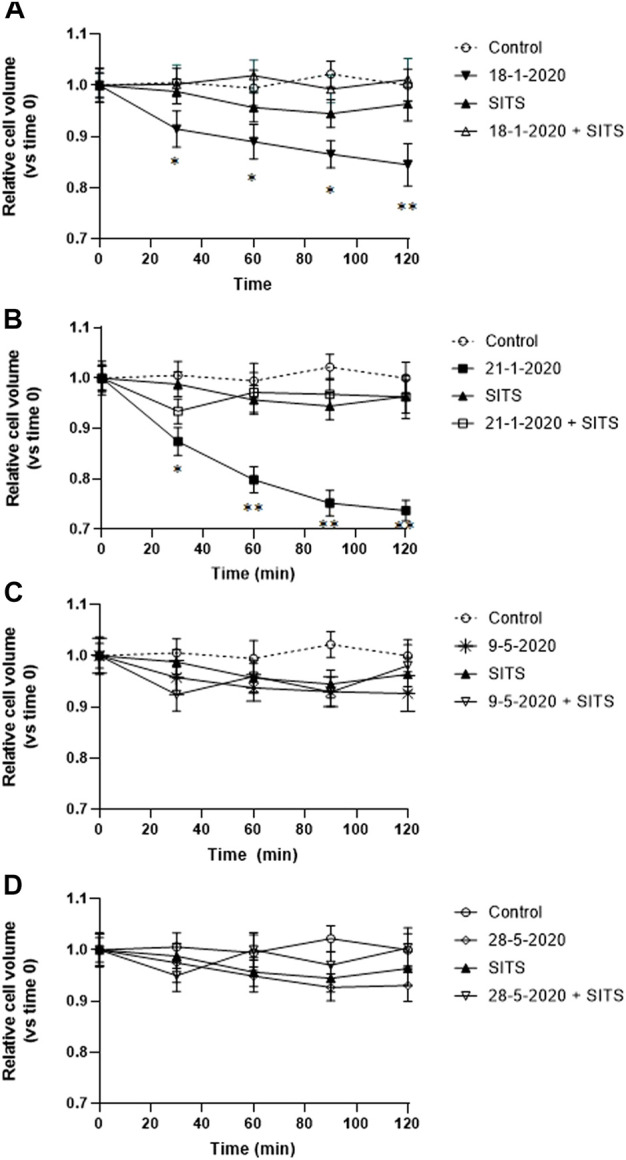
(A–D) Effect of SITS (0.5 mM) on the time-course of cell volume change in A549 cells during the first 2 h of exposure to the aqueous extracts each of the 4 PM10 samples. Cell volume changes were expressed as percentage cell size compared to the size of the cells at time 0. *p < 0.05; **p < 0.01.