
FIGURE 7.
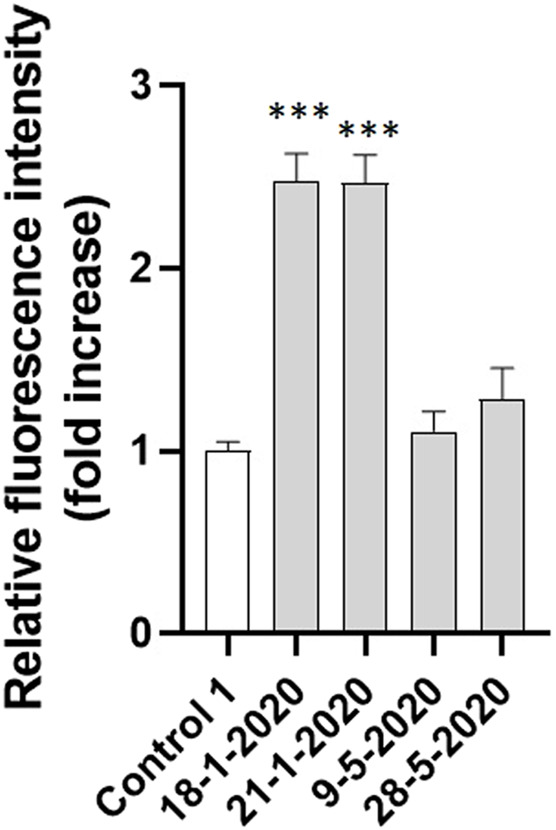
Intracellular fluorescence of A549 cells exposed to the four PM10 aqueous extracts for 15 min and charged with the ROS sensitive probe CM-H2DCFDA (extract dilution used for all the samples: 50%). The statistical analysis of data was performed by one way ANOVA and Dunnett’s multiple comparison test.