Figure 1.
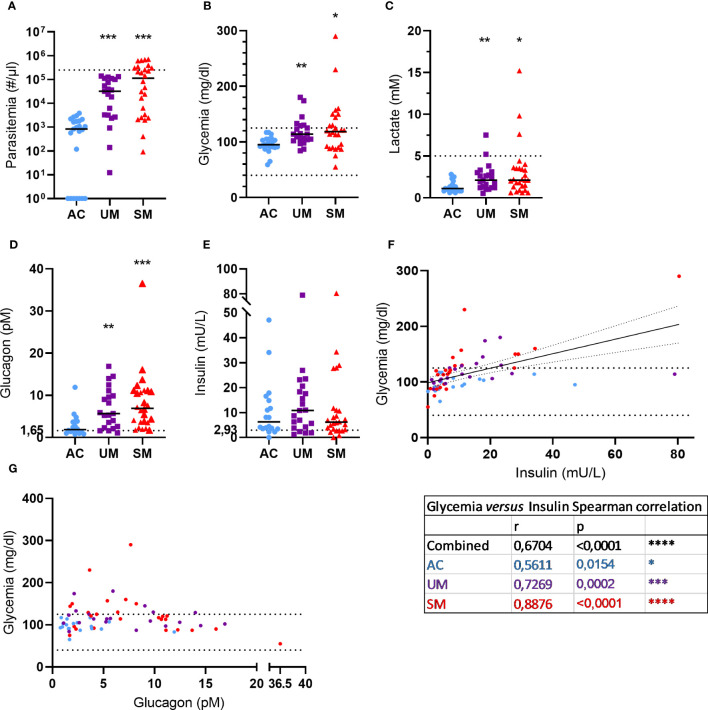
Blood and plasma analytes. (A) Parasite levels were microscopically determined on thick smears and calculated using the concentration of white blood cells in the blood that was determined. The dotted line represents the hyperparasitemia threshold of 250,000 par/µl. (B, C) Glucose and lactate levels were measured in whole blood. The dotted lines show the hypo- and/or hyper- thresholds. (D, E) Plasma glucagon and insulin levels. Dotted lines represent the limits of detection. (F, G) Correlation between insulin or glucagon levels and glycemia. Spearman r- and p-values are shown. (A, G) Each symbol represents data from an individual. (A, E) Horizontal lines in between data points represent group medians and analysis was by Mann-Whitney U-test. Asterisks above individual data sets indicate statistical differences compared to the AC group. Only significant differences are indicated. * p<0.05, ** p<0.01, *** p<0.001, **** p<0.0001. AC n=23 (A-C) n=18 (D-G); UM n=21; SM n=26.

