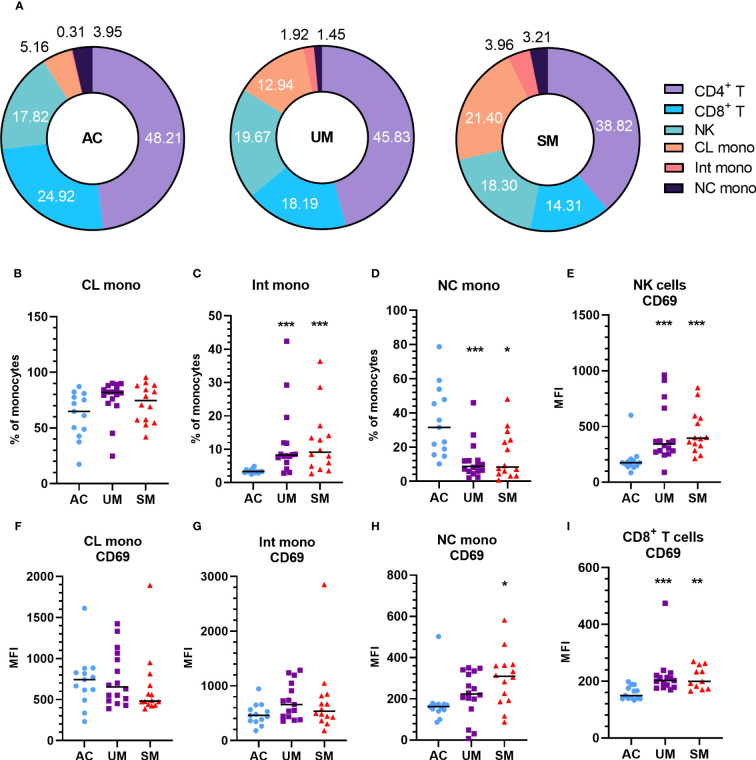
Figure 2.
Increased monocytes and activation of PBMC subsets in patients with malaria. PBMCs were isolated and flow cytometry was performed on fresh cells. (A) Percentages of different cell subsets in the AC, UM and SM group. (B-D) Percentage of monocyte subsets relative to the total number of monocytes. (E-I) Median fluorescence intensity (MFI) of CD69 on the respective cell subsets. (B-I) Each symbol represents data from an individual. Horizontal lines in between data points represent group medians and analysis was by Mann-Whitney U-test. Asterisks above individual data sets indicate statistical differences compared to the AC group. * p<0.05, ** p<0.01, *** p<0.001. NK, Natural Killer; CL mono, classical monocyte; Int mono, Intermediate monocyte; NC mono, Non-classical monocyte. Only significant differences are indicated. AC n=13; UM n=16; SM n=14. For CD4+ T cells (A) UM n=15; SM n=13 and for CD8+ T cells (A, G) UM n=15 SM n=11.

