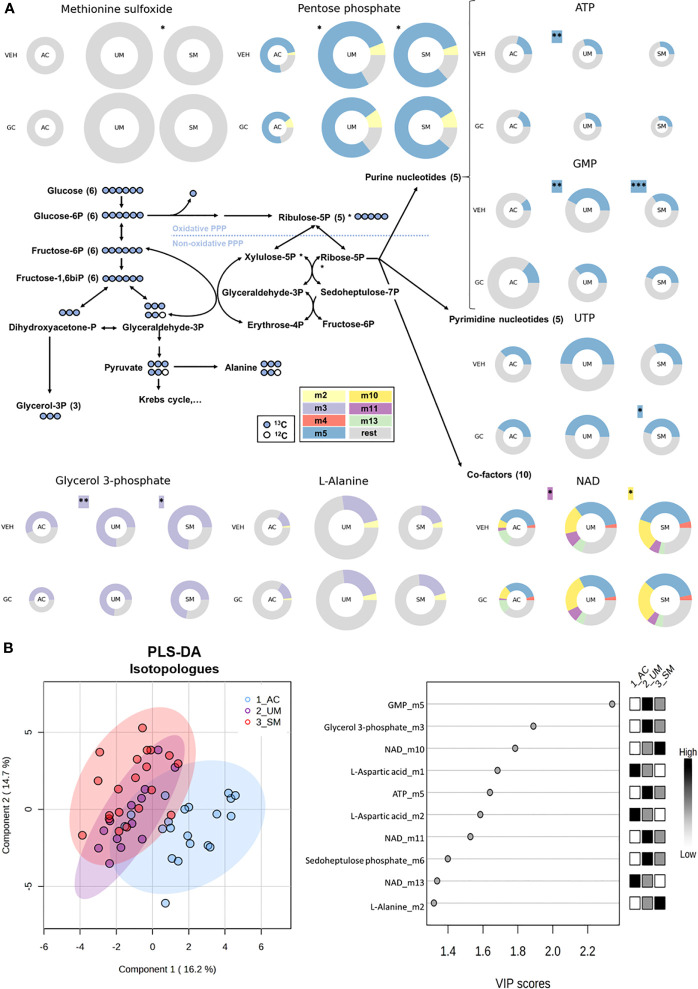
Figure 6.
The pentose phosphate pathway is enhanced in PBMCs from patients with malaria. PBMCs were isolated and incubated for 24 hours with [U-13C]-glucose tracer and vehicle (VEH) or 150 nM hydrocortisone (GC). Metabolic extracts were analyzed via mass spectrometry. (A) Schematic visualization of the pentose phosphate pathway with donut plots of selected metabolites. The size of the donuts represents the average relative abundancy compared to the AC VEH condition. The average relative contribution of an isotopologue is represented by the different colors as defined in the legend. The rest fraction contains the unlabeled and rare isotopologue (<2%) fractions. Analysis was done by t-test for UM and SM versus AC as indicated with asterisks next to the donuts on the VEH row. A paired t-test for the GC effects in AC, UM and SM is indicated with asterisks next to the donuts on the GC row. Non-highlighted asterisks represent effects in abundancies. Highlighted asterisks correspond with effects in specific isotopologues. Only significant differences are indicated. (B) PLS-DA was performed to separate AC, UM and SM based on 41 corrected isotopologues from VEH-incubated PBMCs. PLS-DA: Partial Least Squares Method-Discriminant Analysis; PPP, pentose phosphate pathway; VIP, Variable Importance in Projection. * p<0.05; ** p<0.01; *** p<0.001. Abundancies: AC n=20; UM n=14 (12 paired); SM n=22 veh (21 paired). Isotopologues: AC n=20; UM n=13 (11 paired); SM n=20 (18 paired).

